You are using an out of date browser. It may not display this or other websites correctly.
You should upgrade or use an alternative browser.
You should upgrade or use an alternative browser.
That Wacky Redhead
- Thread starter Brainbin
- Start date
Threadmarks
View all 109 threadmarks
Reader mode
Reader mode
Recent threadmarks
One Last Night at the Movies 1985-86: The Best-Laid Plans The Power of Networking Castles in the Sky Appendix B, Part XI: As the World Turns Appendix C, Part VII: Smaller, More Personal Pictures Say It Ain't So, Lucy! Epilogue: September 20, 1986First things first: thank you all for helping That Wacky Redhead to reach a milestone of 600,000 views!  Words cannot express the depth of my appreciation.
As one small token of my appreciation, I'd like to present the "missing link" infobox, for the Canadian Federal Election of 1972 (which I already posted on the Infoboxes thread in Maps and Graphics, inspired by the many excellent Canadian election infoboxes to be found there). Notice the pretty pictures, courtesy canadahistory.com:

You can find the relevant update right here.
Thank you very much, John! I certainly appreciate your kind words.
As a matter of fact, I would like to take this opportunity to announce that this timeline is nominated for the superlative Turtledove award for Best Feature!
You can vote for That Wacky Redhead, specifically for the character of That Wacky Redhead herself, right here.
I would also like to take this opportunity to heartily endorse the stunning artwork by nixonshead, a friend of this timeline, for Eyes Turned Skyward, written by two other friends of this timeline, e of pi and Workable Goblin. You can vote for it right here - but don't take my word for it! See for yourself before you vote!

Words cannot express the depth of my appreciation.As one small token of my appreciation, I'd like to present the "missing link" infobox, for the Canadian Federal Election of 1972 (which I already posted on the Infoboxes thread in Maps and Graphics, inspired by the many excellent Canadian election infoboxes to be found there). Notice the pretty pictures, courtesy canadahistory.com:
You can find the relevant update right here.
I'm happy for the Turtledove, Brainbin. You've fully deserved it.
Thank you very much, John! I certainly appreciate your kind words.
As a matter of fact, I would like to take this opportunity to announce that this timeline is nominated for the superlative Turtledove award for Best Feature!
You can vote for That Wacky Redhead, specifically for the character of That Wacky Redhead herself, right here.
I would also like to take this opportunity to heartily endorse the stunning artwork by nixonshead, a friend of this timeline, for Eyes Turned Skyward, written by two other friends of this timeline, e of pi and Workable Goblin. You can vote for it right here - but don't take my word for it! See for yourself before you vote!
JSmith
Banned
Congratulations Brainbin- very richly deserved !
related to the thread


These are the Voyages -TOS: Season One
Like This PageLiked · 16 minutes ago
We truly DO love Lucy! Find out how she made the Enterprise come to life!
http://bit.ly/1gv45CQ
related to the thread
These are the Voyages -TOS: Season One
Like This PageLiked · 16 minutes ago
We truly DO love Lucy! Find out how she made the Enterprise come to life!
http://bit.ly/1gv45CQ
Thank you very much! Please don't forget, everyone, about the Superlative Turtledove Award for Best Feature, in which That Wacky Redhead is also competing.Congratulations Brainbin- very richly deserved !
She - and I - would very much appreciate your votes! Please consider casting a ballot in her favour
And thanks for the link! It's always nice to see people appreciating her contributions to the Star Trek mythosJSmith said:We truly DO love Lucy! Find out how she made the Enterprise come to life!
http://bit.ly/1gv45CQ
And now, for a few more pictures! These illustrate the composition of the Canadian House of Commons at the beginning of three successive Parliaments:
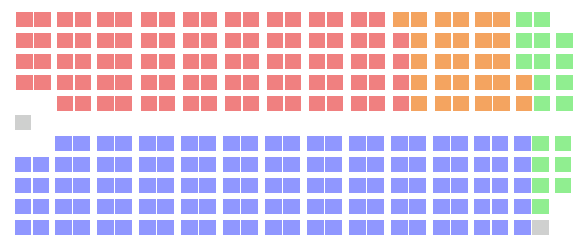
The 29th Canadian Parliament, which began sitting on January 8, 1973 (a Monday). There are 264 seats. The typical seating chart places all the Government seats in the bottom section, from left to right, and then the Official Opposition seats in the top section, also from left to right. Only if the government has a majority (more than half the seats) do their seats spill over into the top section, also from left to right; if the government has a minority (fewer than half the seats), the overhang in opposition seats carries over to the bottom section. In this fashion, either the largest or the smallest opposition party is always adjacent to the governing party; note also that larger parties always get first claim to seats closer to the empty space in the middle (representing the frontbenches), before filling each column out. The blue seats represent the governing PCs (or Tories), with 123 seats. The red seats represent the Official Opposition, the Liberals, with 92 seats. The orange seats represent the NDP, with 28 seats; and the green seats represent the Socreds/Creditistes, with 19 seats. The two grey seats are filled by independents: the lone seat in the middle-left, the Speaker's chair, is occupied by former Liberal Lucien Lamoureux; the seat in the lower-right, in the back row near to the PC caucus, is held by former (and future) Tory Roch LaSalle.
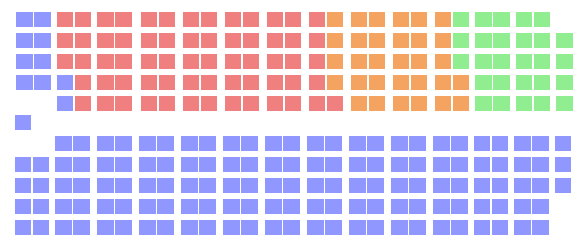
The 30th Canadian Parliament, which began sitting on October 7, 1974 (a Monday). Observe the "spillover" effect from the Tory majority on the chart, and how the other parties are jockeying for frontbench seats. Again, there are 264 seats total: the PCs hold 142 (including the Speaker's chair); the Liberals 64; the NDP 31; and the Socreds 27.
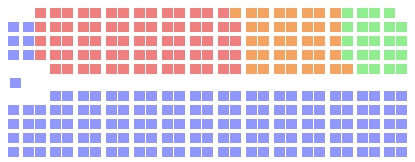
And, finally, the 31st Canadian Parliament, which is in a different resolution because the number of seats are different: 282. It began sitting on October 16, 1978 (a Monday). It's easier to appreciate using this seating chart how stable the party caucuses remained in proportion to the Commons as a whole. The PCs won 149 seats; the Liberals 73; the NDP 37; and the Socreds 23 (making them the only party to lose seats, even though they - along with the NDP - gained vote share as the Tories and Liberals declined).
I also found electoral district maps prepared by the Canadian government which depicted the results for the elections of 1972, 1974, and 1979 IOTL, though unfortunately I lack the artistic skill to remove all the artifacts from those images and attempt to paint over them with the results ITTL. If any cartography enthusiasts reading this thread might be up to the challenge of creating templates for depicting alternate Canadian parliamentary elections, let me know (though I won't hold my breath
)The poll for Best Feature closes in just over six hours and continues to be a real horse-race Every vote counts, so please make yours be heard!
Every vote counts, so please make yours be heard!Thande
Donor
If any cartography enthusiasts reading this thread might be up to the challenge of creating templates for depicting alternate Canadian parliamentary elections, let me know (though I won't hold my breath
Well, at the moment I'm doing those OTL Canadian election maps for 2004, 2006 and 2008 you asked about a while back to go with the 2011 one, but after that I might be able to work something up, depending on how detailed the source maps are.
Thank you very much, Mefisto!Done. You can guess what feature I was voting for.
The poll for Best Feature closes in one hour, and it's still entirely possible for That Wacky Redhead to win! (Remember, even a tie counts as a win under Turtledove rules.)
But it can't happen without your vote! So please head on over and cast your ballot
JSmith
Banned
Thank you very much! Please don't forget, everyone, about the Superlative Turtledove Award for Best Feature, in which That Wacky Redhead is also competing.
She - and I - would very much appreciate your votes! Please consider casting a ballot in her favour
Done and looks like my vote just put her ahead by 1-for now.
And thanks for the link! It's always nice to see people appreciating her contributions to the Star Trek mythos
My pleasure.
JSmith
Banned
Wonderful- I voted just in time and it made a difference !Definitely 3 more huzzahs for BrainbinAnd That Wacky Redhead ekes out a narrow victory, 79-76-73. Congratulations, Brainbin!
Thank you both very much for your show of support - and to everyone who voted for That Wacky Redhead! It was a very near thing through the whole week of voting, and I fell behind for most of the last day only to surge back ahead in that final hour. Like I said before, every vote does make a difference!And That Wacky Redhead ekes out a narrow victory, 79-76-73. Congratulations, Brainbin!
Wonderful- I voted just in time and it made a difference !Definitely 3 more huzzahs for Brainbin
As was only proper, That Wacky Redhead - an awards veteran - gave a short speech accepting her Turtledove Awards (with some additional commentary from me as well).
I'd like to apologize for the continued delay in the posting of my next update, but I do have an excuse: as many of you know, I have been posting occasional guest updates for Eyes Turned Skyward, a timeline by e of pi and Workable Goblin, against which I have been honoured to compete in the Turtledoves for three consecutive years, and which itself took home two Turtledoves of its own for the spectacular artwork by nixonshead. All three of these gentlemen are good friends of That Wacky Redhead.
And I endeavour to be a good friend to Eyes Turned Skyward, which has resulted in yet another guest post to their timeline!
Please stop on by and give it a read.
Popular Movement
Popular Movement
Football, throughout most of the world, referred to the sport properly called association football, and also known as soccer; ironically, the countries where this was most often not the case were those in the Anglosphere, other than the British Isles, from which the beautiful game had originated in the mid-19th century. This was because many other sports originating from the British Isles had also come to be known as football, particularly those based on the game of rugby (a full-contact sport which, oddly, involved far less kicking and was not played with a ball). Rugby had followed colonists throughout the British Empire and into the United States, evolving alongside the immigrant cultures of their new lands in distinct forms. In North America, football described a descendant of rugby often called gridiron football, though the sport was played slightly differently in Canada and the United States (the variants becoming known as “Canadian football” and “American football”, respectively). Though it had initially been popular only amongst amateurs and at college campuses, the sport quickly caught on, definitively overtaking the cherished “National Pastime” of baseball by the 1970s in the United States. In Canada, ice hockey continued to reign supreme, but football was clearly in second place, especially given its perception as a homegrown sport, and the native professional major league (the CFL) which – uniquely – was not shared with that of the United States. [1] This was in stark contrast to the American imports of baseball and basketball (though the latter had been invented by a Canadian, James Naismith). By 1980, Canada had two teams in each foreign league: the Montreal Expos and the Toronto Blue Jays in MLB; and the Montreal Olympians and the Toronto Huskies in the NBA. By comparison, Canada played host to seven of the twenty-four NHL teams, and supported its own top-level professional football organization, the Canadian Football League, with nine teams. The CFL enjoyed the open endorsement of the Prime Minister, Robert Stanfield, who was an avid football fan.
However, Stanfield, being a politician, had a much larger ambition. He wanted to bring the CFL to his hometown of Halifax (which he also represented in Parliament). The largest city in the most populous province of the Maritime region, Halifax had benefited mightily from the pork brought in by the federal PCs, who dominated both the province and the region. The Halifax metro area had a larger population than one of the cities that already supported a CFL team – Regina, Saskatchewan – though the population of the city proper, at 125,000, was smaller. What it mostly lacked, however, was the proper facility to host a professional football team, and when the investors came calling, the federal government was more than happy to oblige – it was “only fair”, after all, given all the investment package that had gone into Montreal for the Olympics facilities, the airport, and the high-speed rail lines. Although Halifax was much smaller and less economically significant than Montreal, surely it deserved at least some of those same perks? In this case, it helped that Nova Scotia Premier John Buchanan, a fellow Tory and close Stanfield ally, had agreed to support the construction of a stadium in nearby Dartmouth – both governments provided the funding needed to cover the estimated $6 million construction costs. It was in place for 1982, when the CFL granted an expansion team to the “Atlantic Schooners”, as they were officially known, who would play in a 30,000-seat stadium which would be completed in 1984. [2] It was just one example of the “arena fever” which swept North America in the 1980s, as many mid-sized cities sought expansion teams from the professional sports leagues, and had to build facilities to entice them. And if expansions could not be sought, than poaching an existing team was the next best thing, and there were multiple examples of this throughout the early 1980s…
Indeed, there was even a parallel football story within the parallel football league, in Indianapolis, which was a city on a mission. The former “India-no-place”, the nowhere capital of Flyover Country, was undergoing a thorough revitalization process as the 1980s dawned, pioneered by mayor-turned-Senator Richard Lugar, with the ardent support of local business interests, and continued by his successor, Michael Carroll. [3] In hopes of changing his city from “a place to stop over” into “a place to stay”, Carroll sponsored the construction of the Indiana Convention Centre, a sprawling complex which would be headlined by a new stadium, the Hoosier Dome. But as far as Carroll and other backers were concerned, the facilities were an empty shell without an anchor tenant. It needed an NFL team. And they were convinced to get one, by any means necessary. But the NFL was not expanding, so they would have to be… aggressive. The Baltimore Colts, at first, had seemed a tempting target – but the Baltimore press had learned of tentative negotiations to relocate and was able to agitate the populace sufficiently so as to encourage the Colts ownership to seek out local buyers, who purchased the team shortly thereafter. [4] Surprisingly, it was in sunny, prosperous California that the ideal team was found: the Oakland Raiders. Raiders management were dissatisfied with their own stadium and threatened to move unless the city paid for improvements; local officials balked, and though management tried to move by Los Angeles by fiat, this was rejected by the NFL. Oakland, thinking that the team was bluffing, continued to refuse to pay for improvements, but it would ultimately cost them; the team was relocated in Indianapolis in 1982, after it was shown that the Hoosier Dome would be built to the exact specifications sought by Raiders management. It was a powerful lesson to civic planners everywhere: sports teams would be willing to move for the mere promise of what they wanted rather than spare the expense and stay put for what they viewed as sub-par facilities. It saw the emergence of a series of multiple economic arms races which came to define the decade and its propensity for public works projects: the bigger, the better.
And then there was the international example: St. Louis. It stood in stark contrast to Indianapolis, having always been problematic as a location for an NHL team. Though Missouri was technically a Midwestern state, it had always retained a strong Southern heritage: it was the birthplace of Mark Twain; a slave state until the Emancipation Proclamation, and a border state in the Civil War; and the Ozarks, the hillbilly country immortalized by the Paul Henning rural sitcoms of the 1960s – Henning himself had been born in Independence [5] – extended into the southern half of the state. Hockey was, unsurprisingly, quite unpopular there – locals preferred baseball (the Cardinals, established in 1892, had been the southernmost and westernmost MLB team until the 1950s) and, increasingly, football and stock-car racing. [6] Hockey was about as popular in Northern Missouri as it was anywhere else in the Midwest, but the Blues had only been in St. Louis since 1967, and many fans remained true to the Chicago Black Hawks. It didn’t help that Missouri was the smallest Midwestern state to have a hockey team other than the cold-weather Minnesota. Indeed, it had once supported two teams – the Scouts had briefly played in Kansas City before moving to Denver as the Colorado Rockies, taking much of their Kansan fanbase with them. [7] Although hockey had been very good to the Midwest, the unique circumstances in Missouri had mitigated its rise there, and the St. Louis Blues – whose success in the rink was commensurate with their popularity outside of it – were soon sold to other interests. Nobody in the Gateway to the West was interested in keeping the team playing at St. Louis Arena; indeed, throughout the United States, buyers were scarce. [8] Therefore, they became the second team to migrate to the Great White North in the early 1980s (after Atlanta to Calgary) when they were purchased by a consortium based in the Ontario city of Hamilton. Its leaders had long hoped to see the NHL return to their city (a team called the Tigers had briefly played there in the 1920s), and to that end, built an arena of their own. Unlike Halifax, Hamilton investors sought no government funding to do so; the resources of the powerful steel industry were based in the city, accordingly known as “Steeltown” – a Pittsburgh of the North, although Gary, Indiana was probably more apt in terms of its locale: a city on the Great Lakes, barely outside the shadow of its much larger neighbour. However, Chicago was much larger and more dominant counterpart to Gary than Toronto was to Hamilton.
In fact, by 1981, Toronto proper was increasingly diminishing when compared to its neighbours: it was home to the provincial legislature and a large university, as well as numerous arts, entertainment, and sports facilities, but these were only supported by 575,000 souls. The population of the city had fallen precipitously since 1971, with many people (as in most American cities) withdrawing to the suburbs; Montreal’s population, on the other hand, remained stable, increasing very slightly to 1.25 million. [9] In fact, the population of Toronto had fallen slightly behind that of its largest suburb, North York (which had 580,000 residents). [10] It and another Toronto suburb, Mississauga, were among the Top 10 largest cities in the country, at #3 and #9, respectively (with Toronto itself at #4). Hamilton, the Steel City of Canada, was the eighth-largest city in the country, with 325,000 people. [11] That four out of the ten largest cities in Canada were located in the “Golden Horseshoe” region – so named because of the approximate shape of the western shore of Lake Ontario which defined it – was telling of the region’s overall population. In fact, Hamilton in many ways seemed a rougher, grittier Toronto in miniature: it had a large, prestigious research university (McMaster) within its borders, and had genteel, affluent suburbs of its own, including the wealthy city of Burlington. It was no surprise that it would eventually seek even greater prominence through the construction of a new sports arena (and, by extension, luring an NHL team). The project even had a star backer in the face of former NHL player, and current entrepreneur, Tim Horton.
Horton had been one of the hockey greats of his generation, who had won four Stanley Cups as a defenceman for the Toronto Maple Leafs in the 1960s. Hamilton was an adopted hometown of sorts for him; he had opened a doughnut shop there in 1964 which, by two decades later, had expanded into a chain of 100 shops scattered throughout the Golden Horseshoe region. Expansion might have been even more rapid if not for Horton’s drunk driving auto accident in early 1973, which left him paralyzed from the waist down. [12] A changed man, he became an advocate of wheelchair accessibility – ordering the conversion of all his existing shops to allow for the entry of handicapped customers, well before the practice came into vogue elsewhere – and the growing lobby in opposition to drunk driving. By consequence (and for synergistic reasons) the arena, which would be named Copps Coliseum after a long-serving former mayor of Hamilton (Victor K. Copps), would be fully wheelchair-accessible and would offer Tim Horton coffee and doughnuts as an alternative to the beer and other food items which would also be available at the venue. [13]
The Blues were renamed the Hamilton Bulldogs, in a roundabout reference to the previous NHL team to serve the city. That team had been known as the Tigers, but that name could not be reused because the local pro football team was the Hamilton Tiger-Cats. However, the Tigers had been moved from Quebec City, where they were (informally) known as the Bulldogs. The name was chosen over more Hamilton-specific names like “Steelers” in hopes of appealing to the residents of the surrounding areas – many of whom were already fans of the Toronto Maple Leafs or the Buffalo Sabres. [14] The presence of the Bulldogs in Hamilton boosted the Canadian presence in the NHL to eight teams, against sixteen American teams. This restored the 2:1 national ratio that had prevailed during the “Original Six” era. Sold in 1982, the team played one last lame-duck season in St. Louis before they were to move to Hamilton to begin play in the newly-completed Copps Coliseum in the 1983-84 NHL season.
Between football in Halifax, and hockey in Calgary and Hamilton, Canada seemed more united than ever in its love and zeal for sport. But Quebec had always been the odd province out. Prior to the Quiet Revolution of the late 1960s, it had been a pastoral, socially conservative province – one of the last bastions of established support for the Roman Catholic Church in the Western world. It had been a province that supported the notion of a Canadian national identity while most of the English-speaking country still felt some allegiance to the increasingly moribund British Empire; just as English Canadians finally began to warm to the concept, Quebecers did an about-face, instead identifying as Québecois, favouring secular, socialist values. Many of them also believed that Quebec would be better off independent from Canada, though the nature and degree of this proposed independence was nebulous, at best. René Lévesque, the leader of the separatist Parti Québecois, who served in that capacity as the Premier of la belle province from 1976, supported a system which he called “sovereignty-association” – basically, the Quebec and Canadian economies would continue to be intertwined, but Quebec would otherwise enjoy complete political and legislative independence. It was a system which defied easy comparisons, because it was notoriously vague on the details – but the EEC was often mentioned as something that the new “partnership” could strive towards. But it wasn’t something that Canadians – or the Canadian government – would take lying down, and they took whatever steps they could in order to prevent that eventuality from coming to pass.
The famous Montreal-to-Mirabel “Rocket” line, completed in 1978, had always been intended to be the first in a series of high-speed rail lines which were planned to criss-cross the populous stretch of land along the Windsor-to-Quebec City axis. Mirabel Airport was thriving, despite its great distance from the downtown core, entirely because the travel time was so short. Other Canadian cities sought to emulate this link, particularly arch-rival Toronto, whose own International Airport, though only half as far from the central business district, was still inconvenient to access by car. [15] The provincial government of Ontario, a classic Red Tory administration led by Premier Bill Davis, campaigned in the 1977 election promising to build that high-speed rail link, insisting that Toronto remain competitive with Montreal. His party narrowly won a majority, largely at the expense of the provincial Liberals (whose power base was mostly outside Toronto – from which they were entirely shut out). The federal government, meanwhile, sought to link Montreal, the largest city, with Ottawa, the national capital – the “Federalist line”, as it came to be known (in French, le ligne fédéraliste) was intended to strengthen the physical connection between Quebec and Canada. Premier Lévesque, aware of the symbolic implications of building such a line, nonetheless contributed to its construction because (in order to attract provincial investment) the line was planned to be newly-constructed – travelling from Montreal via the existing Mirabel “Rocket” line, and then continuing along the east bank of the Ottawa river, remaining entirely within Quebec – crossing the river into Ontario only just outside Ottawa – where a bridge was to be built south of the newly-amalgamated city of Buckingham, which was also north of the Ontario village of Cumberland, some 30 kilometres due east of Ottawa. This was informed by the presence of the Rivière du Lièvre, flowing through Buckingham, which was also wide enough to merit the construction of a large bridge (meaning that one would have to be built, one way or the other). On the Ontario side of the river, existing rail lines were planned to be replaced with the high-speed rail, and a second Montreal-to-Ottawa connection, bypassing the airport, would eventually be built; or, barring that, a route to Montreal from Kingston, via Cornwall (along the St. Lawrence River).
12.25% of the population of Quebec (or about 800,000 people) claimed English as their mother tongue in the 1981 census; 13.75% (or 900,000) described it as their home language. In absolute numbers, this was a slight increase from the 1971 census; however, as a share of the population it marked a decline. [16] (This was partly due to the rise of Allophones, who spoke neither English nor French at home, who were 7% of the Quebec population in 1981). Nearly all Anglo-Canadian immigrants had settled in the West Island of Montreal, or near to Mirabel, where large numbers of English-speaking workers were needed at the new airport to deal with travellers from the rest of Canada (along with the US, the UK, and other countries in the Anglosphere), the new domiciles built in Dorval once the airport had been demolished were overwhelmingly English-speaking, much like many of the surrounding municipalities. These new migrants came to be known in French as les voleurs, in a pun typical of that language (as “voleur” can mean “flyer”, referring to moving in where an airport had either closed or opened, or “thief”, referring to these migrants having “stolen” opportunities from the Québécois). The Parti Québécois sought to strengthen the position of the French language in Quebec as a prelude to separation from the rest of Canada, and his government passed restrictive language laws almost immediately upon gaining power. They were granted Royal Assent in 1978 [17], against the protest of Prime Minister Robert Stanfield – however, the PM had nothing to leverage against Lévesque, as had not been the case for Bourassa before him. However, his advocacy for the Anglo-Quebecer community won him several seats in Montreal in the 1978 federal election, even as he lost support elsewhere in the province (though all of his MPs held their seats thanks to their personal, idiosyncratic popularity). [18]
The referendum marked a resounding defeat for the Oui column, with 58% of voters rejecting sovereignty-association. Although the secret ballot prevented exact knowledge of how each linguistic community voted, breaking down the districts poll-by-poll indicated that the Francophone voters were about evenly divided on the issue – Anglophones were near-unanimously in favour of Non, as were Aboriginals. Allophones, though less decisive in their support of Non, did break heavily in that direction. An estimated 40% of the population were Oui-voting Québecois; turnout was very high, at 90% of the vote, an unheard-of number for federal or provincial elections. Lévesque put on a brave face, even claiming that “If I’ve understood you well, you’re telling me ‘until next time’”. [19] But Lévesque and his party was defeated in the 1981 elections by a resurgent Liberal Party of Quebec, which won thanks to the collapse of the Union Conservateur. [20] Raymond Garneau became the new Premier of Quebec, and sought to redefine the place of Quebec within a united Canada. Robert Stanfield, the Prime Minister of Canada for nearly a decade at this point, sought much the same thing, though for very different reasons…
Interest in aping the high-speed railway program pioneered in Canada was immediate and powerful in the United States, but federal funding (considered a firm necessity, given the massive infrastructure costs) was not forthcoming until the 97th Congress was seated in early 1981 – the Democratic-controlled House (with support from the Wallace Americans, who were, fortunately for the Democrats, known for their love of pork) was enthusiastic about high-speed rail, in particular freshman Rep. George Takei of California, a key early sponsor, who was eager to implement the reforms he had brought to Los Angeles on a much larger scale. He had the support of President Glenn on this issue. The Republican-controlled Senate played along, aware of the need to rehabilitate their economic reputation after the second major recession of the late-1970s was blamed on Reaganomics. The testbed would be the line from Penn Station to the Newark Airport Station, crossing under the Hudson River by way of the North River Tunnels. Announced as part of Glenn’s initial barrage of initiatives during his first 100 days in office, the rail line was completed in time for the elections of 1981, which likely helped to secure Governor Thomas Kean (a Republican) to his second term in office – more for the promise of future rewards, as opposed to the tangible gain of linking Newark with Midtown Manhattan. Although the line was not given a nickname (unlike the Canadian “Rocket” line), it did have a hockey connection – Penn Station was located immediately underneath Madison Square Garden, home of the New York Rangers. This connection had virtually no impact on planning, however – linking a busy railway station with a busy metro airport was intended as a prelude for connecting the entire Northeast Corridor, from Boston to Washington, DC – Governor Kean had signed on to the agreement largely because Newark-to-Trenton had been promised as the first high-speed rail extension from Newark. From there, plans were in place to extend it through Philadelphia, Wilmington, and Baltimore, on the way to Washington, D.C. Where high-speed rail would go from there was a bigger question, and one which hinged on the Glenn Administration’s vaunted “Invest in America” policy. Rep. Takei, unsurprisingly, favoured introducing it into California (proposing a Los-Angeles-to-San-Francisco line, jokingly called the “Fault Line” by supporters and opponents alike). Other obvious candidates included the Chicago metro area, and the “Texas Triangle” of Dallas, Houston, and San Antonio. Which of these lines, among others, might come next was a question that would determine the shape of transportation policy for the remainder of the decade.
---
[1] The CFL did eventually (and briefly) expand into the United States in the 1990s, IOTL, seeking (as many professional football leagues did at that time) to function as an “alternate” or “parallel” league to the firmly entrenched NFL. On the other hand, as previously mentioned, no American major football leagues have ever entered Canada, and their one OTL attempt to do so would have been blocked by federal legislation had they not backed down. As has been made clear in this update, Stanfield is a huge football fan, and though he’s probably less culturally-protectionist and reflexively anti-American than Trudeau, he would unquestionably share his opinion as regards this issue.
[2] There was every intention for the Schooners to play IOTL – a franchise had been granted, though it was conditional upon the completion of a suitable stadium. However, the funding for said stadium never materialized, and the bid collapsed. The CFL has never again made a serious attempt to permanently expand into the Maritimes IOTL.
[3] The OTL mayor of Indianapolis at the time, William H. Hudnut, who was responsible for many of the same initiatives as Carroll ITTL, was still in the House at the time that Lugar was elected to Senate ITTL (two years earlier than IOTL, remember) and did not run against Carroll in the subsequent general election.
[4] The Colts were indeed moved to Indianapolis in 1984, IOTL, to the enduring heartbreak of Baltimoreans. As ITTL, the city and its people were vociferously against such a move, so (as my Hoosier consultant e of pi puts it) Indianapolis stole them in the night, moving them out under cover of darkness. The CFL, of all leagues, were able to exploit the void left behind with their own Baltimore-based team, the only one in their ill-fated expansion into the US to be successful. In fact, the NFL felt so threatened by this that they moved the Cleveland Browns to the city in 1996, where they play as the Ravens to this day. (The CFL team then moved to Montreal and became the new Alouettes).
[5] Independence, of course, is also famous for having been the jumping-off point of the Oregon Trail, a route plagued with heartbreak, dysentery, and “peperony and chease”.
[6] Yes, by which I do mean NASCAR. Even today it still retains that redneck, hillbilly stigma – back then, it was still struggling to break through into the mainstream.
[7] Missouri is an intriguing place, geographically. Its two largest cities (and metro areas) are on opposite ends of the state from each other, each bordering another state (Illinois, across the Mississippi River, in the case of St. Louis; and, fittingly enough, Kansas, in the case of Kansas City – in fact, there is another Kansas City in Kansas, right across the border). St. Louis is often called the “western-most Eastern city”, and Kansas City likewise the “eastern-most Western city”; it helps that the mean centre of population for the whole country has been between them since 1980 (IOTL). Kansas City attracted the NFL Chiefs in 1960, the MLB Royals in 1969, and the NHL Scouts in 1974; although the Scouts left to become the Rockies in 1976 IOTL and ITTL, they would then move again, to Newark (as the New Jersey Devils) in 1982 IOTL.
[8] There were few interested buyers IOTL, either, and the Blues were very nearly sold to interests in Saskatoon, the second-largest city in Saskatchewan (with barely more than 150,000 people at the time, and a metro area of perhaps 200,000, if that – at the time, St. Louis alone had 450,000 people, and its metro area had 2.9 million) before the NHL nixed the deal. The Blues were purchased at the eleventh hour by Harry Ornest, who kept them in the city, where they remain to this day. (ITTL, Ornest – who would IOTL go on to own the CFL’s Toronto Argonauts – was ironically part of the consortium that would move the Blues to Hamilton.) I should emphasize that, even ITTL, Hamilton is the smallest NHL market by a considerable margin – though it has a lot more people than Saskatoon within a reasonable distance, even though it’s sharing them.
[9] Montreal’s population declined IOTL, as well, from 1.21 million in 1971 to 980,000 in 1981 (a 19% decline). However, ITTL, the success of the Olympics, the demolition of the airport (and related facilities) on the island, the construction of new infrastructure promoting urban renewal, and the less restrictive English-language laws (though the city proper is largely francophone) all combine to keep Montreal robust (which, by extension, retards the growth – or rather, accelerates the decline – of Toronto).
[10] Toronto had 600,000 people in the 1981 census IOTL, a 16% decline from 1971. North York, just to the north of Toronto proper (think of it as the Brooklyn to Toronto’s Manhattan) had “only” 560,000 people in 1981, though the fact that it had not yet been granted city status in 1971 shows how massive its growth had been in that decade.
[11] IOTL, Montreal was at #1, Toronto was at #2, North York was at #5, Mississauga was at #8, and Hamilton was at #9. Rounding out the Top 10 are: Calgary (#3 IOTL, #2 ITTL), Winnipeg (#4 IOTL, #5 ITTL), Edmonton (#6 IOTL and ITTL), Vancouver (#7 IOTL and ITTL), and the nation’s capital of Ottawa (#10 IOTL and ITTL). Worth noting is that 1981 marked the final census in which no city in Canada had over one million residents, thanks to Montreal’s decline in population.
[12] IOTL, this drunk driving accident happened a year later, and it killed him. His business partner, Ron Joyce, then bought out his shares in the company from his widow and turned the company into the powerhouse it is today. Joyce remains Horton’s partner ITTL, and though Horton slows him down, he’s certainly no slouch either.
[13] Molson would win the contract, in exchange for their votes in support of the move to Hamilton from St. Louis (and hoping to prevent a second round of the Beer Wars – likewise, Labatt and Carling O’Keefe back the move wholeheartedly). “Coffee beer”, though rather different (and good deal more literally-interpreted) than what we understand the term to mean IOTL, would become very popular at Bulldogs games (to the point of becoming the unofficial drink of the team).
[14] Maple Leaf Gardens, home arena of the Maple Leafs, is a 45-minute drive from Copps Coliseum (less than 70 km, or about 42 miles). Buffalo Memorial Auditorium, home of the Sabres, is a bit farther away at a 70-minute drive (over 100 km, or about 65 miles). These are, respectively, the shortest and third-shortest distances between two NHL arenas ITTL (in between are those of the New York Rangers and New York Islanders, at 85 km, or 53 miles). Even the distance between Toronto and Buffalo (163 km, or 101 miles) was only (just barely) the fourth-shortest before the move (and at this point IOTL), behind the two New York teams and (in a rather impressive three-way photo-finish) the New York Rangers and Philadelphia (at 160 km, or 99.5 miles) Hartford and Boston (at 161 km, or 100 miles).
[15] Toronto International Airport would, IOTL, eventually be named for Lester B. Pearson, winner of the Nobel Peace Prize and Prime Minister for five very eventful years (1963-68). Like Dorval vis-à-vis Montreal, it is not located within Toronto proper but a nearby suburb (Mississauga).
[16] Given that language laws were much harsher IOTL, and were enacted earlier, the English-speaking population of Quebec cratered through the 1970s, down to 10.9% who spoke it as their mother tongue, and 12.7% who used the language at home (and those numbers would only continue to decline in the coming decades, though they have recently stabilized). Many of those emigrant Anglophones – and their business interests – headed for, you guessed it, Toronto, bolstering that city (and more vitally, its service sector) during a crucial period, and sparing it the fate suffered by many other Great Lakes cities IOTL.
[17] In yet another linguistic pun, 1978 was referred to ITTL by those sympathetic to the government of Quebec as « an de Mirabel », referring to the (Latin) expression annus mirabilis (despite describing the passage of a bill which strengthened the French language), while also acknowledging that year’s launch of the Rocket line… to Mirabel.
[18] The narrator has not seen fit to mention that one of these Montreal-area Tories is young lawyer – and key Stanfield ally – Brian Mulroney, who ran at the urgings of the PM himself. Mulroney fittingly won the seat that included Dorval. (IOTL, in 1984 he ran for and won the Eastern Quebec seat that included his hometown of Baie-Comeau, but ITTL he instead runs for a Montreal-area seat where he is deemed to have a better chance.)
[19] Or, as he said in his native French: « Si je vous ai bien compris, vous êtes en train de nous dire à la prochaine fois ! » He said this IOTL as well, and given that he lost almost 3-to-2 in that election, something tells me that he would have said it no matter what.
[20] Despite losing the referendum IOTL by an even larger margin, Lévesque was able to hold onto power in the election that followed – because the third-party that collapsed in 1981 was playing spoiler for the PQ (who won anyway) in 1976, as opposed to the Liberals – who, in turn, won anyway in 1989 IOTL, even with the presence of an English minority-rights party (the Equality Party) siphoning off votes – and then the PQ won in 1993, even though that smaller party had collapsed.
---
And thus concludes the 1981-82 cycle! Just four more to go. Thank you all for your continued and seemingly inexhaustible patience! Thanks also to e of pi for his help and advice in the making of this update, and for assisting with the editing! As always, I endeavour to bring you updates by the end of the month, and I have once again succeeded, however narrowly! Here’s hoping I can keep it up at least once more, but in the meantime, I’m hoping that March will be a banner month for the timeline!
Last edited:
Great update and conclusion to this cycle. Love the bit about trains. Hope you elaborate more on them and on other initiatives of the Glenn Administration in future cycles.
As always, a fascinating update! This time we get a look into the Wide World of Sports...
Well, you've butterflied away my childhood; I grew up in a city with no NFL team, no NBA team, and no NHL team, so it's probably no coincidence that I became a big fan of baseball and college basketball.
Finding a local ownership group for the Colts is going to be interesting, because Baltimore in the early 80s was undergoing a transition from the shipping economy it had for the previous three centuries to a more lucrative technology and service-based one.
In 1980, D.C.-based lawyer Edward Bennett Williams of Williams & Connolly purchased the Orioles (and became infamous as a cheapskate); he almost certainly would be interested in the Colts, but probably (a) stretched too thin financially and (b) in sufficiently declining health at age 60 -- he would die eight years later IOTL -- to become majority owner. He can probably be convinced to put up a minority stake, though.
One possibility is Charles P. "Buzz" McCormick, Jr., then President and CEO of McCormick & Company, the spice company famously located (until 1989, at least, IOTL) in downtown Baltimore.
I know this isn't a political timeline, but let's pause for a second to talk about the two major political trends that you've set up that will radically realign the United States for decades (at least).
First, in terms of economics: with Reaganomics not merely discredited ITTL, but actually reviled on the level of Whip Inflation Now!, and an unabashedly economically-liberal policy being associated with the economic boom of the early 1980s, you've chopped off the entire right half of the political economic spectrum. Presumably, Reagan still says something on the close order of, "Government is not the solution to our problem -- government is our problem" in 1976; that sentiment is going to be mocked and reviled (even within the Republican party!) roughly analogously to Jimmy Carter's "malaise" speech. For at least a generation to come, laissez-faire-ism is going to be deader than disco (which itself probably isn't a phrase ITTL).
Second, without Jimmy Carter to begin the process of politicizing evangelical Christians -- and Ronald Reagan, ably aided by the likes of Jerry Falwell, to finish the job -- you've thwarted the rise of the religious Right as a political force as well. In the early '70s IOTL, conservative evangelicals generally adopted a policy of withdrawal from the political process rather than engagement in it, viewing government as something to be acquiesced to ("Render unto Caesar...") rather than engaged with.
In short: the U.S. political goalposts have moved way to the left... and all on account of That Wacky Redhead!
One area of nascent conservatism in TTL may be the southwest if we presume that the Glenn administration will be generally less interventionist in South America and less likely to take a hardline stance on illegal immigration. Those areas may come to see "Investing in America" as "Encouraging Flight From Mexico" and may become the hotbed for anti-Glenn sentiments. Another challenge will be ensuring that the benefits of infrastructure investments -- if not the high-profile projects -- are spread to rural and southern areas as opposed to just flowing to coastal cities.
As suggested above, from a purely political perspective, the Texas Triangle is the obvious choice to try and expand "Invest in America" away from the coastal cities to the heartland.
The Baltimore Stallions played for two seasons at venerable Memorial Stadium (former home of the Orioles) from 1994-1995, making it to the championship game as an expansion team in '94 and actually winning the Grey Cup in '95. The team average attendance was nearly 35,000 fans across both seasons.
I... coffee-flavored Molson? I mean, I've had coffee *stout* before, but this sounds pretty atrocious.
The Baltimore Colts, at first, had seemed a tempting target – but the Baltimore press had learned of tentative negotiations to relocate and was able to agitate the populace sufficiently so as to encourage the Colts ownership to seek out local buyers, who purchased the team shortly thereafter. [4]
Well, you've butterflied away my childhood; I grew up in a city with no NFL team, no NBA team, and no NHL team, so it's probably no coincidence that I became a big fan of baseball and college basketball.
Finding a local ownership group for the Colts is going to be interesting, because Baltimore in the early 80s was undergoing a transition from the shipping economy it had for the previous three centuries to a more lucrative technology and service-based one.
In 1980, D.C.-based lawyer Edward Bennett Williams of Williams & Connolly purchased the Orioles (and became infamous as a cheapskate); he almost certainly would be interested in the Colts, but probably (a) stretched too thin financially and (b) in sufficiently declining health at age 60 -- he would die eight years later IOTL -- to become majority owner. He can probably be convinced to put up a minority stake, though.
One possibility is Charles P. "Buzz" McCormick, Jr., then President and CEO of McCormick & Company, the spice company famously located (until 1989, at least, IOTL) in downtown Baltimore.
This connection had virtually no impact on planning, however – linking a busy railway station with a busy metro airport was intended as a prelude for connecting the entire Northeast Corridor, from Boston to Washington, DC – Governor Kean had signed on to the agreement largely because Newark-to-Trenton had been promised as the first high-speed rail extension from Newark. From there, plans were in place to extend it through Philadelphia, Wilmington, and Baltimore, on the way to Washington, D.C. [/FONT][/COLOR]Where high-speed rail would go from there was a bigger question, and one which hinged on the Glenn Administration’s vaunted “Invest in America” policy.
I know this isn't a political timeline, but let's pause for a second to talk about the two major political trends that you've set up that will radically realign the United States for decades (at least).
First, in terms of economics: with Reaganomics not merely discredited ITTL, but actually reviled on the level of Whip Inflation Now!, and an unabashedly economically-liberal policy being associated with the economic boom of the early 1980s, you've chopped off the entire right half of the political economic spectrum. Presumably, Reagan still says something on the close order of, "Government is not the solution to our problem -- government is our problem" in 1976; that sentiment is going to be mocked and reviled (even within the Republican party!) roughly analogously to Jimmy Carter's "malaise" speech. For at least a generation to come, laissez-faire-ism is going to be deader than disco (which itself probably isn't a phrase ITTL).
Second, without Jimmy Carter to begin the process of politicizing evangelical Christians -- and Ronald Reagan, ably aided by the likes of Jerry Falwell, to finish the job -- you've thwarted the rise of the religious Right as a political force as well. In the early '70s IOTL, conservative evangelicals generally adopted a policy of withdrawal from the political process rather than engagement in it, viewing government as something to be acquiesced to ("Render unto Caesar...") rather than engaged with.
In short: the U.S. political goalposts have moved way to the left... and all on account of That Wacky Redhead!
One area of nascent conservatism in TTL may be the southwest if we presume that the Glenn administration will be generally less interventionist in South America and less likely to take a hardline stance on illegal immigration. Those areas may come to see "Investing in America" as "Encouraging Flight From Mexico" and may become the hotbed for anti-Glenn sentiments. Another challenge will be ensuring that the benefits of infrastructure investments -- if not the high-profile projects -- are spread to rural and southern areas as opposed to just flowing to coastal cities.
Rep. Takei, unsurprisingly, favoured introducing it into California (proposing a Los-Angeles-to-San-Francisco line, jokingly called the “Fault Line” by supporters and opponents alike). Other obvious candidates included the Chicago metro area, and the “Texas Triangle” of Dallas, Houston, and San Antonio. Which of these lines, among others, might come next
was a question that would determine the shape of transportation policy for the remainder of the decade.
As suggested above, from a purely political perspective, the Texas Triangle is the obvious choice to try and expand "Invest in America" away from the coastal cities to the heartland.
[4] The Colts were indeed moved to Indianapolis in 1984, IOTL, to the enduring heartbreak of Baltimoreans. As ITTL, the city and its people were vociferously against such a move, so (as my Hoosier consultant e of pi puts it) Indianapolis stole them in the night, moving them out under cover of darkness. The CFL, of all leagues, were able to exploit the void left behind with their own Baltimore-based team, the only one in their ill-fated expansion into the US to be successful. In fact, the NFL felt so threatened by this that they moved the Cleveland Browns to the city in 1996, where they play as the Ravens to this day. (The CFL team then moved to Montreal and became the new Alouettes).
The Baltimore Stallions played for two seasons at venerable Memorial Stadium (former home of the Orioles) from 1994-1995, making it to the championship game as an expansion team in '94 and actually winning the Grey Cup in '95. The team average attendance was nearly 35,000 fans across both seasons.
[13] Molson would win the contract, in exchange for their votes in support of the move to Hamilton from St. Louis (and hoping to prevent a second round of the Beer Wars – likewise, Labatt and Carling O’Keefe back the move wholeheartedly). “Coffee beer”, though rather different (and good deal more literally-interpreted) than what we understand the term to mean IOTL, would become very popular at Bulldogs games (to the point of becoming the unofficial drink of the team).
I... coffee-flavored Molson? I mean, I've had coffee *stout* before, but this sounds pretty atrocious.
Just for some context, the story of bringing the Colts to the city was a part of Indy lore for years. The Dome was actually IOTL built and completed before the city had a team, and Indy invited Irsay to town in the midst of his issues with Baltimore. The story goes that after a day of being courted by city leadership, he walked out onto the field and looked up at the seats, which were white and blue (if I recall, either because they had been the cheapest colors to acquire or because the city had marked the Colts as the best prospects), and that was the moment he made the decision to move. The move itself was pretty spectacular, and there's a nice gallery here on the Baltimore Sun site showing a retrospective on images of the move, and local political cartoons from the aftermath.
It was a bit of a dirty trick, but as bad as I might feel for Baltimore's side of it, I know why the Indy leadership went all out for it--because of Pacers, Colts, and NCAA revenue (all in playing facilities located in the heart of downtown), I grew up in city with a thriving downtown (though some of the areas just outside of that urban core, notably south of it, did and to an extent do remain distressed to this day).
It was a bit of a dirty trick, but as bad as I might feel for Baltimore's side of it, I know why the Indy leadership went all out for it--because of Pacers, Colts, and NCAA revenue (all in playing facilities located in the heart of downtown), I grew up in city with a thriving downtown (though some of the areas just outside of that urban core, notably south of it, did and to an extent do remain distressed to this day).
Like I said earlier Andy, this essentially at least changes the Religious Right as we know it. At best, the dominant forces will be not Evangelicals, but perhaps disillusioned Catholics. While likely retaining a healthy dose of social conservatism, they won't be Reaganites with crucifixes, thus moving the goalposts left economically at least. It'll be also less South-centric.
Which will, to me, change the face of religious broadcasting. I don't see Mother Angelica being one of the faces of religious broadcasting, simply because she's an adopted Alabamian now (though given her experiences, she might be more successful in marrying old-school talk radio with religious broadcasting there, so while we might not TTL know what she looks like, we well might recognize her voice.). Billy Graham of course seems inevitable, but on the Catholic side you might have someone more like, say, Fr. Fessio or Fr. Hardon, who, as Jesuits, always struck me as a bit more highbrow in their presentation. Might come off as a successor to Fulton Sheen's "Life is Worth Living".
Maybe, we might hear the words, "This is Catholic Television, broadcasting from Brooklyn, New York." Or perhaps L.A.? Cardinal McIntyre knew a lot of Hollywood people, and he's orthodox enough to be interested in countering the overly reformist currents in the Church.
[1] The CFL did eventually (and briefly) expand into the United States in the 1990s, IOTL, seeking (as many professional football leagues did at that time) to function as an “alternate” or “parallel” league to the firmly entrenched NFL. On the other hand, as previously mentioned, no American major or minor football leagues have ever entered Canada, and their one OTL attempt to do so would have been blocked by federal legislation had they not backed down. As has been made clear in this update, Stanfield is a huge football fan, and though he’s probably less culturally-protectionist and reflexively anti-American than Trudeau, he would unquestionably share his opinion as regards this issue.
Not to be pedantic, but the minor league Continental Football League (1965-1969) had the Toronto Rifles (1965-1967). The franchise began life in 1964 as the Quebec Rifles. They played in the United Football League's final season (1964).
Threadmarks
View all 109 threadmarks
Reader mode
Reader mode
Recent threadmarks
One Last Night at the Movies 1985-86: The Best-Laid Plans The Power of Networking Castles in the Sky Appendix B, Part XI: As the World Turns Appendix C, Part VII: Smaller, More Personal Pictures Say It Ain't So, Lucy! Epilogue: September 20, 1986
Share: