Gentleman Biaggi
Banned
1966 Alabama Gubernatorial Election

Albert Brewer (Democratic) 58.7%
Bull Connor (Alabama First) 41.2%
Albert Brewer (Democratic) 58.7%
Bull Connor (Alabama First) 41.2%
Yes, Wallace wins Alabama 81-19, but Nixon still wins two counties (Winston and Macon).There was a similar premise on here, somewhere, with the Republicans gaining back the black vote, and Democrats returning to their previous status as the "Southern" Party. This map, I think, is a good visual depiction of such a scenario. I assume Wallace breaks 80% in Alabama?
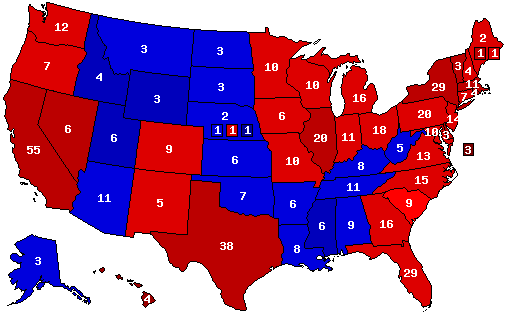
How many seats is that?I found out about a CNN poll that had the Democrats leading the Republicans by 18% for 2018. I had to map it out (showing the margin of error, as well):
View attachment 361390
<snip>
436.
So do I. But they asked how many seats there were, so that was what I answered.I think they meant how many seats do the Dems win in this scenario. Also, wow at Alaska going Dem.
What were the circumstances of that special election? Did the Republican shoot a puppy?As some of you may know, there was recently a special election in Tennessee which swung 46 (!) points to the Democrats. I mapped out what the house elections would look like under that same swing.

It sort of seems like these results assume that each state is more or less totally independent of neighboring states. for instance, Holland does substantially better than Obama did in Arkansas, but does worse in Mississippi. as for the state results, this would be my guess:Here's another county map that I created. This is of the alternate 2016 presidential election in the "Holland Scenario", the one in which a Democratic incumbent wins a landslide in 2020, in an alternate timeline. In his first election, Holland faces...Mitt Romney. He wins, though obviously it is a closer election. Holland's victory, however, is larger than those of Obama in 2008 or 2012. Based upon this county map, which states would go Republican? Which ones Democratic?
Also here, if you cannot see the image: http://fiction.wikia.com/wiki/File:...results_by_county,_2016_(Holland_Version).png.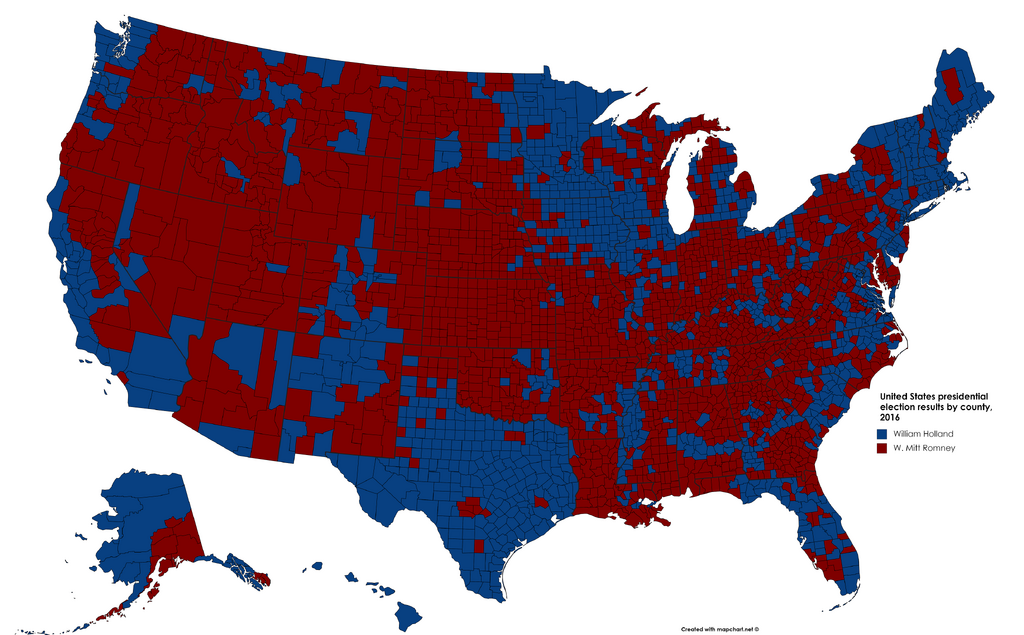
This seems reasonably accurate. And when you compare it to the landslide four years later, you can grasp the changes that occur. What, do you think, would be the popular vote margin here?It sort of seems like these results assume that each state is more or less totally independent of neighboring states. for instance, Holland does substantially better than Obama did in Arkansas, but does worse in Mississippi. as for the state results, this would be my guess:
BigThis seems reasonably accurate. And when you compare it to the landslide four years later, you can grasp the changes that occur. What, do you think, would be the popular vote margin here?
Well, it is that, but what would the percentages look like, roughly? I suspect it would be somewhere in the mid-to-upper fifties, perhaps 55-59%, but I'm not exactly sure. It would definitely be smaller than the reelection, where the percentage was 66%.
I’m not familiar with the universe or the conditions of the electionWell, it is that, but what would the percentages look like, roughly? I suspect it would be somewhere in the mid-to-upper fifties, perhaps 55-59%, but I'm not exactly sure. It would definitely be smaller than the reelection, where the percentage was 66%.
Well, the Democratic coalition would be a combination of minorities, a substantial segment of poor and working-class whites (a similar proportion to what Bill Clinton got in the 1990s), and socially liberal to moderate suburbanites. The Republican coalition would be a combination of evangelicals, rural voters, the majority (though not the overwhelming majority) of working-class whites, and moderate-to-conservative suburbanites. Republicans would be strongest in the interior Western and Upper Appalachian states; Democrats in the Northeast and West Coast, as well as parts of the Midwest. There would still be a good number of "Blue Dog" Democrats in Oklahoma, Arkansas, Texas, Georgia, Tennessee, the Carolinas, Virginia, and Missouri, as you can gather from the map. The Democratic Party would be more like the party of Clinton or Jimmy Carter, ideologically speaking, while the Republicans would have a combination of Reaganite and Nixonian views.I’m not familiar with the universe or the conditions of the election
But I’m assuming the democrat wins upwards of 57% of the vote
What’s the voting coalitions for each party looking like?
Then damn the last republican must’ve fucked up badWell, the Democratic coalition would be a combination of minorities, a substantial segment of poor and working-class whites (a similar proportion to what Bill Clinton got in the 1990s), and socially liberal to moderate suburbanites. The Republican coalition would be a combination of evangelicals, rural voters, the majority (though not the overwhelming majority) of working-class whites, and moderate-to-conservative suburbanites. Republicans would be strongest in the interior Western and Upper Appalachian states; Democrats in the Northeast and West Coast, as well as parts of the Midwest. There would still be a good number of "Blue Dog" Democrats in Oklahoma, Arkansas, Texas, Georgia, Tennessee, the Carolinas, Virginia, and Missouri, as you can gather from the map. The Democratic Party would be more like the party of Clinton or Jimmy Carter, ideologically speaking, while the Republicans would have a combination of Reaganite and Nixonian views.