You are using an out of date browser. It may not display this or other websites correctly.
You should upgrade or use an alternative browser.
You should upgrade or use an alternative browser.
Alternate Electoral Maps II
- Thread starter Aaaaasima
- Start date
- Status
- Not open for further replies.
Threadmarks
View all 43 threadmarks
Reader mode
Reader mode
Recent threadmarks
Pericles-Obama landslide in 2008 Pericles-Obama does better in 2012 Tex Arkana-Carter runs a better campaign in 1976 and picks Frank Church as his running mate, winning in a landslide. DPKdebator-Trump landslide in 2016 wildviper121-Trump landslide based off of someone's Campaign trail game DPKdebator-The worst you can do as Hillary Clinton in the campaign trail game TheSaint1950-Last gallup poll in 1948 is right jonnguy2016-Trump self-sabotage@Temeraire, I notice that you've liked many of my Rutherford posts up to this point. I was wondering if you had any questions or other comments related to them.
@Temeraire, I notice that you've liked many of my Rutherford posts up to this point. I was wondering if you had any questions or other comments related to them.
Oh, not particularly. Landslide scenarios are interesting, if only to see how the geography changes. Have you thought about what any downballot races might look like?
I've posted articles and maps, over at Fiction Wiki, of the Senate, House, and gubernatorial elections in this timeline.Oh, not particularly. Landslide scenarios are interesting, if only to see how the geography changes. Have you thought about what any downballot races might look like?
Here is another map that I've created. This map depicts the election results by congressional districts (in their present forms), of the Sandoval Landslide, within the New Rutherford Scenario, that I posted earlier (and can be found here: https://www.alternatehistory.com/fo...ectoral-maps-ii.417468/page-353#post-17934207). I had to speculate as to what the results would be, but I figured Sandoval would win all but the most heavily Democratic urban/minority districts, along with a handful of rural/exurban districts (i.e. MA-01 and MA-04 in Massachusetts, MN-08 in Minnesota, WA-06 in Washington, TX-28 in Texas, etc.). Given the county results, this seems somewhat reasonable. @TimTurner, do you think these results are reasonable?
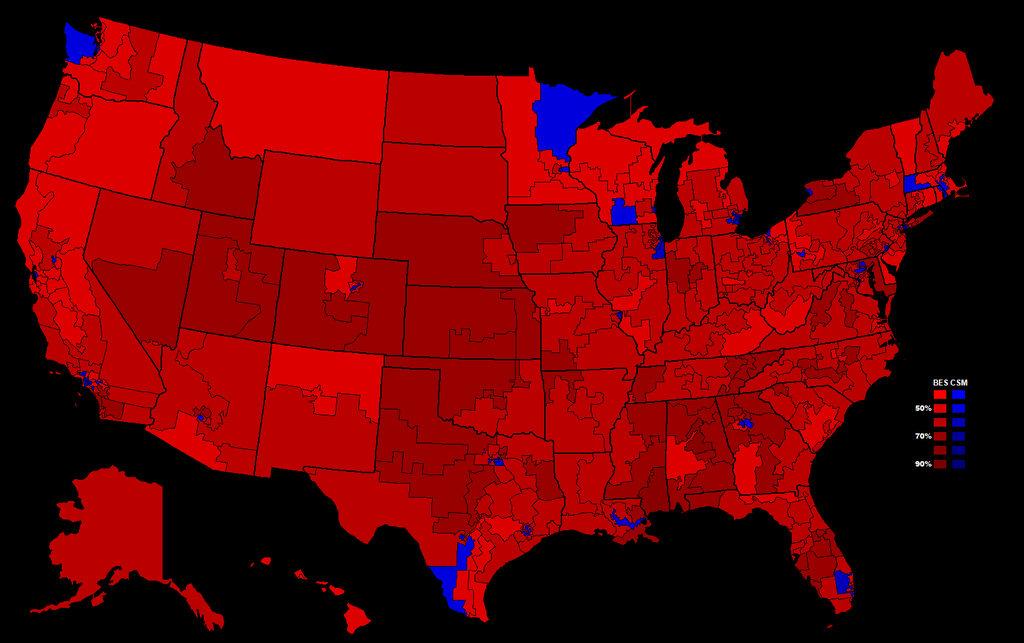
Overall, Sandoval wins ~370 congressional districts; Murphy carries 65.
Overall, Sandoval wins ~370 congressional districts; Murphy carries 65.
snip
How could a Republican win the Mississippi 2nd and Alabama 7th districts?
If you look at the county map here (https://www.alternatehistory.com/fo...ectoral-maps-ii.417468/page-353#post-17934207), which I referred to in my post, a case can be made that both districts go Republican. I used Nixon's maps from 1972 for Alabama and Mississippi, and it was established earlier that Sandoval gains ~25% of the black vote. Combining that with overwhelming dominance among white voters, I think, as well as considering the county results, would make those districts flip. And as noted, it is within the New Rutherford Scenario, which is an alternate timeline.How could a Republican win the Mississippi 2nd and Alabama 7th districts?
Interestingly enough, most Black Voters in the South are reliably Conservative. If the Republicans dropped the barely-veiled racism and did some real outreach, they could achieve nigh-unprecedented dominance across the entire South without the need for any kind of Voter Suppression.How could a Republican win the Mississippi 2nd and Alabama 7th districts?
This timeline supposes that Republicans do just that. Democrats still have an overwhelming hold on the black vote, but Republicans are capable of getting up to 15-30% of the black vote from time to time, unlike in our reality.Interestingly enough, most Black Voters in the South are reliably Conservative. If the Republicans dropped the barely-veiled racism and did some real outreach, they could achieve nigh-unprecedented dominance across the entire South without the need for any kind of Voter Suppression.
Also, @Temeraire, if you go back to my prior Rutherford post, you'll see that I posted a new version of the election results by congressional district for that election, using the same template that I used for Sandoval's results. I find it to be a much better and more visually appealing template than the old one I had.
Surprised, would expect the Nile to be much higher in population.Constituencies of the Roman Empire. Equipopuluous.
I see. I just wanted to make sure. I speculated on this map, in contrast to the painstaking district-by-district calculations that I performed for the Rutherford Scenario.@Calthrina950 nothing jumps out at me as obviously wrong.
The Cartogram was densest in what was AlexandriaSurprised, would expect the Nile to be much higher in population.
I guess it’s a hypothetical modern landslide electionWhat is the Rutherford scenario supposed to be?
It's a Democratic landslide in a alternate timeline set in the modern day. I've invested a considerable amount of time and effort into developing it.What is the Rutherford scenario supposed to be?
Threadmarks
View all 43 threadmarks
Reader mode
Reader mode
Recent threadmarks
Pericles-Obama landslide in 2008 Pericles-Obama does better in 2012 Tex Arkana-Carter runs a better campaign in 1976 and picks Frank Church as his running mate, winning in a landslide. DPKdebator-Trump landslide in 2016 wildviper121-Trump landslide based off of someone's Campaign trail game DPKdebator-The worst you can do as Hillary Clinton in the campaign trail game TheSaint1950-Last gallup poll in 1948 is right jonnguy2016-Trump self-sabotage- Status
- Not open for further replies.
Share: