Alternate Electoral Maps II

Status
Not open for further replies.
1:58 A.M. E.S.T.

McManus: Welcome back to Election Night 20XX, America. There are no current projections to make as the last three states remain uncalled. Baker currently leads in the Electoral College by 7 votes, 255-248.

3sZkAGZ.png


OREGON - 71% reporting
Baker/Sandoval: 705,816 (49.72%)
Manchin/Klobuchar: 698,992 (49.23%)
Others: 14,901 (1.05%)

McManus: Oregon still has many ballots left to count, though Baker currently has a small lead. However, Ohio and Missouri are reporting well over 90% of their results and do not have a declared winner yet.

MISSOURI - 96% reporting
Manchin/Klobuchar: 1,333,767 (49.51%)
Baker/Sandoval: 1,333,445 (49.50%)
Others: 26,402 (.99%)

McManus: In Missouri, Manchin has taken a slim lead of 322 votes. 4% of the vote has yet to be uncounted, so we cannot yet project the Show Me State.

OHIO - 99% reporting
Baker/Sandoval: 2,704,091 (49.51%)
Manchin/Klobuchar: 2,702,997 (49.49%)
Others: 54,431 (1.00%)

McManus: Baker has maintained a slim lead of 1,094 votes in the Buckeye State. Ohio has voted for the winner of every presidential election since 1964, and it is likely that the winner of the election snags Ohio. Currently, Baker can win without Ohio but he must take both Missouri and Oregon, while Manchin cannot win without Ohio even if both Missouri and Oregon vote Democratic.
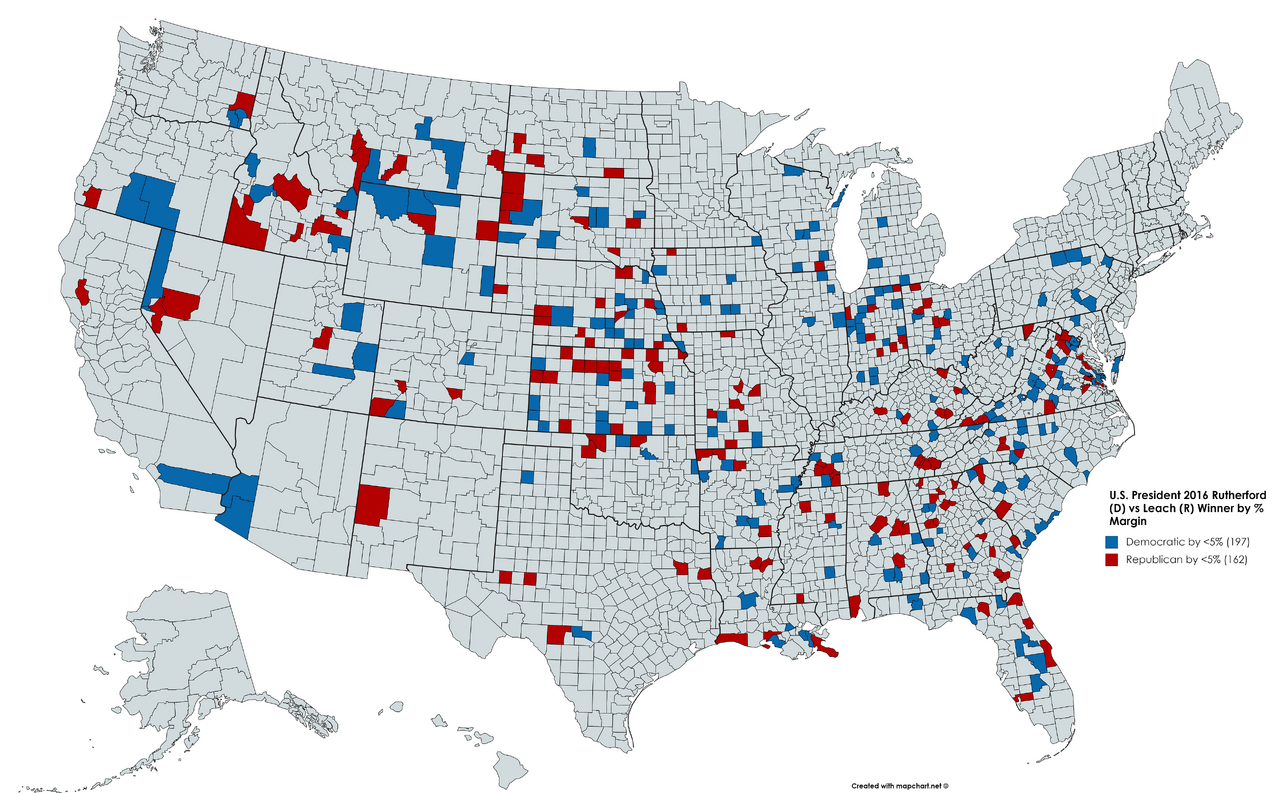
 
Here is a revised version of my Rutherford-Leach close counties map. That is, this is a revised version of the map that I made earlier, showing which counties are carried by either Rutherford or Leach by a margin of 5% or less:

1280

Rutherford wins 197 counties by a margin of 5% or less; Leach carries 163 counties with a similar margin. Notably enough, there are no counties within five points in Alaska, Delaware, Hawaii, New York, New Jersey, or in New England.​
 
Last edited:
This is going to sound dumb but can anyone remember whether I posted a county map for a Dukakis landslide? I recall working on that map but I can't remember whether I ever finished it or posted it and I'd like to re-do it assuming I didn't.
 
This is going to sound dumb but can anyone remember whether I posted a county map for a Dukakis landslide? I recall working on that map but I can't remember whether I ever finished it or posted it and I'd like to re-do it assuming I didn't.
I'm not sure where it is, but you could try using the search function for this thread to find it.
 
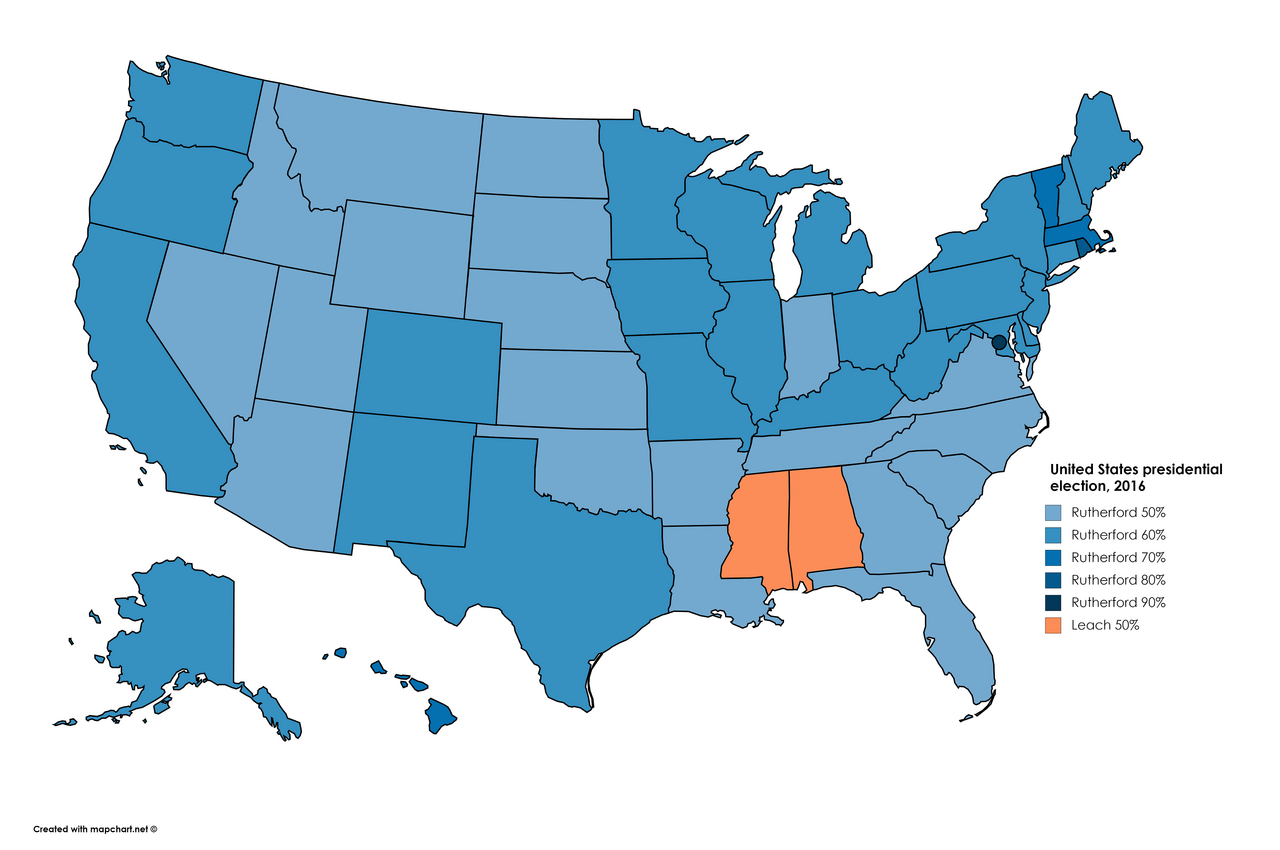
Here's a map of the 2016 election results by state in the Rutherford Scenario, with percentages. I will be posting maps of the white and non-white vote by state (as revised), afterwards, for comparative purposes:

1280

William Christopher Rutherford (D-Texas)/Carlotta Sanchez (D-California)-62.24%-522 EV
Thomas Pirchard Leach (R-Arizona)/Todd Rokita (R-Indiana)-37.58%-16 EV
Close States:
Margin of victory less than 5%:

Idaho, 1.83%
Arizona, 2.30%

Alabama, 4.90%
Margin of victory greater than 5%, but less than 10%:
Nebraska, 5.22%
Virginia, 7.36%
Kansas, 9.03%
Utah, 9.73%
 
Last edited:
Here's a map of the 2016 election results by state in the Rutherford Scenario, with percentages. I will be posting maps of the white and non-white vote by state (as revised), afterwards, for comparative purposes:

The map looks like a bigger 1964 landslide. The home states of Rutherford and Leach only add to this. Is this just Johnson/Brown vs Goldwater/Willkie (or Halleck)?
 
The map looks like a bigger 1964 landslide. The home states of Rutherford and Leach only add to this. Is this just Johnson/Brown vs Goldwater/Willkie (or Halleck)?
The map is a modified version of 1964 (which is especially obvious if you look at the county map I posted on the previous page). But it's an alternate version of the 2016 presidential election, set within an alternate timeline.
 
Last edited:
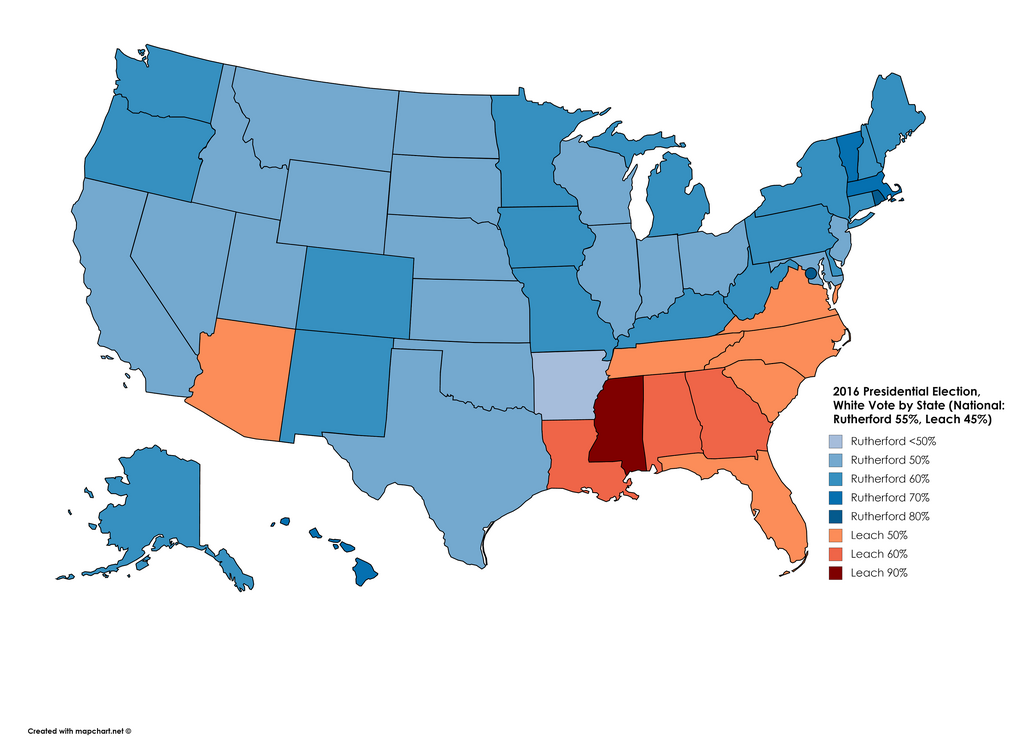
Here's a revised version of the white vote by state map in the Rutherford Scenario:

1024

I came up with these figures based upon the White Vote/Non-White Vote Tables for 2016 that were compiled by reagente (Reagent) over at U.S. Election Atlas. Those tables can be found in the Political Demographics subforum. The actual calculations are of course, those for my scenario. I determined that Rutherford wins, to be exact, 55.31% of the nationwide white vote. There are some states (i.e. California, Illinois, Maryland, New Jersey, Ohio, Wisconsin, Texas), where non-white voters push him over the 60% mark overall. He wins the white vote in every state outside of the South except Arizona, Leach's home state. Rutherford obtains 42% of the white vote there; his margin of victory (2.30%, with 51.15% of the statewide vote) is provided by non-white voters, primarily Hispanics and Native Americans. Rutherford carries white voters by single digits in Kansas, Indiana, Idaho, Maryland, Nebraska, Nevada, Oklahoma, Texas, and Utah. He wins the white vote in three of the nation's four most populous states, winning 60% of whites in New York, 57% in California, and 54% in Texas. In Florida, the nation's third-most populous state after California and Texas, Rutherford obtains 47% of the white vote; his margin of victory there (13.03%, with 56.51% of the statewide vote) obviously comes from non-white voters (i.e. Hispanics and blacks).

Some other states to note are Maryland (50%), Oklahoma (52%), Illinois (57%), New Jersey (58%), Ohio (59%), Washington (60%), Wisconsin (60%), Pennsylvania (61%), Michigan (62%), Colorado (64%), and Minnesota (64%). Rutherford wins over 70% of white voters in Vermont, Massachusetts, and Hawaii, and over 80% in Rhode Island and the District of Columbia. Leach of course, carries white voters in most of the South (11/17 states), including in every former Confederate state bar Texas. Rutherford obtains 41% of the white vote in Virginia, 42% in South Carolina, 44% in North Carolina, 48% in Tennessee, and slightly less than 50% in Arkansas. He wins 40% in Georgia, 38% in Louisiana, and 31% in Alabama. Mississippi, as always, is the most racially polarized state; a whopping 92% of white voters go for Leach.

In some instances, these figures may not be the most accurate that could be devised (i.e. Alaska and New Mexico), but for the most part, I am confident about them. The non-white vote map by state for the scenario will be posted shortly.​
 
Last edited:
@Calthrina950 what would a 50-50 election look like in the Rutherford scenario?
I have no idea. It's taken me months to develop this scenario, and I'm not too moved to develop another one right now, beyond continuing to work on this one. But I imagine it would be similar to a tied electoral map from the 1960s, 1970s, 1980s, or 1990s, with Democrats winning a substantial number of rural counties in the Midwest, Appalachia, and parts of the West, along with most of the major urban counties, and Republicans sweeping most of the suburban counties.
 
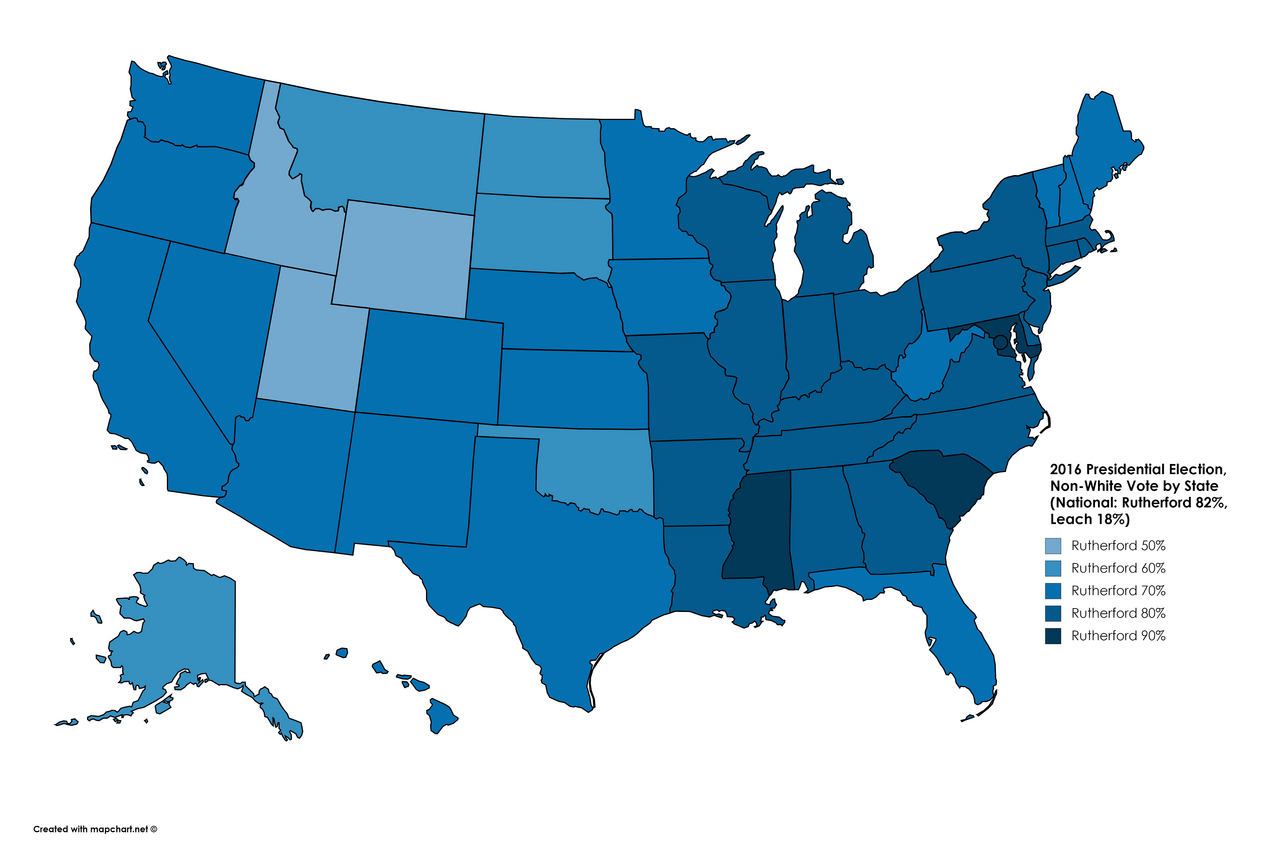
And as promised, here is the map of the non-white vote by state for the Rutherford Scenario:

1280

Rutherford, as you would expect for a Democrat, overwhelmingly wins among non-white voters, obtaining 81.56% of the nationwide nonwhite vote. He carries nonwhite voters in every state. As with the white vote map, I utilized the vote tables from Reagente (Reagent) at U.S. Election Atlas. I generally tried to adhere to the pattern of the nonwhite vote as it has been seen in the past three presidential elections, in OTL. Non-white voters are most Democratic in the Midwest, Northeast, and South, and less so in the West (particularly in the interior West). Nevertheless, Rutherford wins nonwhite voters by double digits everywhere, ranging from 56% in Utah and Wyoming to 96% in the District of Columbia. Non-white voters provide his margin of victory in Arizona, Arkansas, Florida, Georgia, Louisiana, North Carolina, South Carolina, Tennessee, and Virginia. They also make Alabama close (Leach prevails by 4.90%) and save Rutherford from receiving Johnson or McGovern like numbers in Mississippi. The composition of the nonwhite electorate in each state determines how Democratic they are; blacks obviously comprise a larger share in the darker-shaded states and D.C., while Hispanics, Asians, Native Americans, and Others comprise a larger share in the less shaded ones.​
 
Last edited:
Here's the state map for the Dukakis landslide county map that I'm working on. Interestingly, Dukakis wins Alabama while losing Mississippi and Georgia, although all three are decided by less than a single percentage point.

genusmap.php
 
How does Dukakis do this well ITTL?

By running a much better campaign, I would guess. Remember he was ahead by even more than this in the summer of '88 and I think it's largely his own fault that he went from being ahead by double digits to losing by about 8 points in just a few months. He ran a pretty bad campaign.
 
By running a much better campaign, I would guess. Remember he was ahead by even more than this in the summer of '88 and I think it's largely his own fault that he went from being ahead by double digits to losing by about 8 points in just a few months. He ran a pretty bad campaign.

ITTL, if I were to write an alternate 1988 election, it would involve either a stronger candidate, or simply put, the Iran Contra affair destroying the Reagan administration.
 
ITTL, if I were to write an alternate 1988 election, it would involve either a stronger candidate, or simply put, the Iran Contra affair destroying the Reagan administration.
I'm not really writing an alternate timeline, but instead just trying to show what it would have looked like if Dukakis had won in a landslide. In order for it to have actually happened irl, I think you're probably correct that Iran Contra would have had to've completely destroyed the Reagan admin., and Bush would have had to have been seriously implicated.
 
I'm not really writing an alternate timeline, but instead just trying to show what it would have looked like if Dukakis had won in a landslide. In order for it to have actually happened irl, I think you're probably correct that Iran Contra would have had to've completely destroyed the Reagan admin., and Bush would have had to have been seriously implicated.

In one TL in where was Reagan was destroyed, Bush 41 was able to avoid prosecution. However, his own past as a CIA made him a pretty easy target, and he is brutally crushed in the election.

Even if Dukakis behaved like the chuckle-head he was OTL, he still would have defeated Bush.
 
I have no idea. It's taken me months to develop this scenario, and I'm not too moved to develop another one right now, beyond continuing to work on this one. But I imagine it would be similar to a tied electoral map from the 1960s, 1970s, 1980s, or 1990s, with Democrats winning a substantial number of rural counties in the Midwest, Appalachia, and parts of the West, along with most of the major urban counties, and Republicans sweeping most of the suburban counties.

What's the POD for the scenario?
 
Status
Not open for further replies.
Top