You are using an out of date browser. It may not display this or other websites correctly.
You should upgrade or use an alternative browser.
You should upgrade or use an alternative browser.
Alternate Electoral Maps II
- Thread starter Aaaaasima
- Start date
- Status
- Not open for further replies.
Threadmarks
View all 43 threadmarks
Reader mode
Reader mode
Recent threadmarks
Pericles-Obama landslide in 2008 Pericles-Obama does better in 2012 Tex Arkana-Carter runs a better campaign in 1976 and picks Frank Church as his running mate, winning in a landslide. DPKdebator-Trump landslide in 2016 wildviper121-Trump landslide based off of someone's Campaign trail game DPKdebator-The worst you can do as Hillary Clinton in the campaign trail game TheSaint1950-Last gallup poll in 1948 is right jonnguy2016-Trump self-sabotageThose are my three images of the day
Tomorrow will be Nader 2000, Perot 96 and Perot 92
Tomorrow will be Nader 2000, Perot 96 and Perot 92
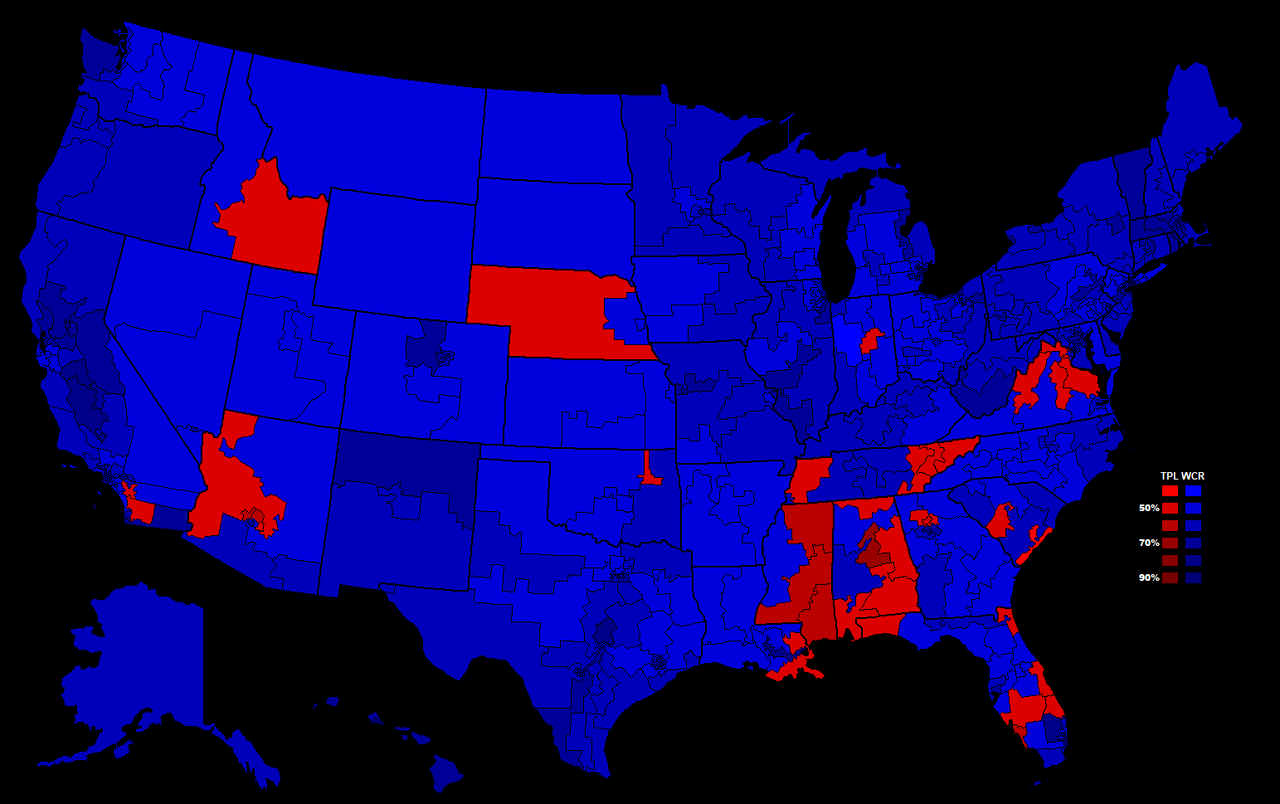
I've deleted my earlier post and created a new one here. After additional calculations, I determined that two districts in Southern California, CA-25 and CA-50 (the districts of Steve Knight and Duncan Hunter, the latter of whom was recently indicted), would also be won by Leach (52-48% and 54-46% respectively), again using the data tables from Daily Kos for reference. This makes sense, particularly with the demographic leanings of the latter and that Leach does best in Southern California, historically the most Republican part of the state. Hence, I had to modify the map again. My modifications in Illinois hold, however. More changes may come in the future, as I try to refine this map to be as realistic as possible. This is the scenario that I have developed the most up to this point, so forgive me if I keep on changing things with it. Other people on here have timelines and scenarios to which they devote a lot of time and effort, so this is that for me:

Last edited:
I've deleted my earlier post and created a new one here. After additional calculations, I determined that two districts in Southern California, CA-25 and CA-50 (the districts of Steve Knight and Duncan Hunter, the latter of whom was recently indicted), would also be won by Leach (52-48% and 54-46% respectively), again using the data tables from Daily Kos for reference. This makes sense, particularly with the demographic leanings of the latter and that Leach does best in Southern California, historically the most Republican part of the state. Hence, I had to modify the map again. My modifications in Illinois hold, however. More changes may come in the future, as I try to refine this map to be as realistic as possible. This is the scenario that I have developed the most up to this point, so forgive me if I keep on changing things with it. Other people on here have timelines and scenarios to which they devote a lot of time and effort, so this is that for me:
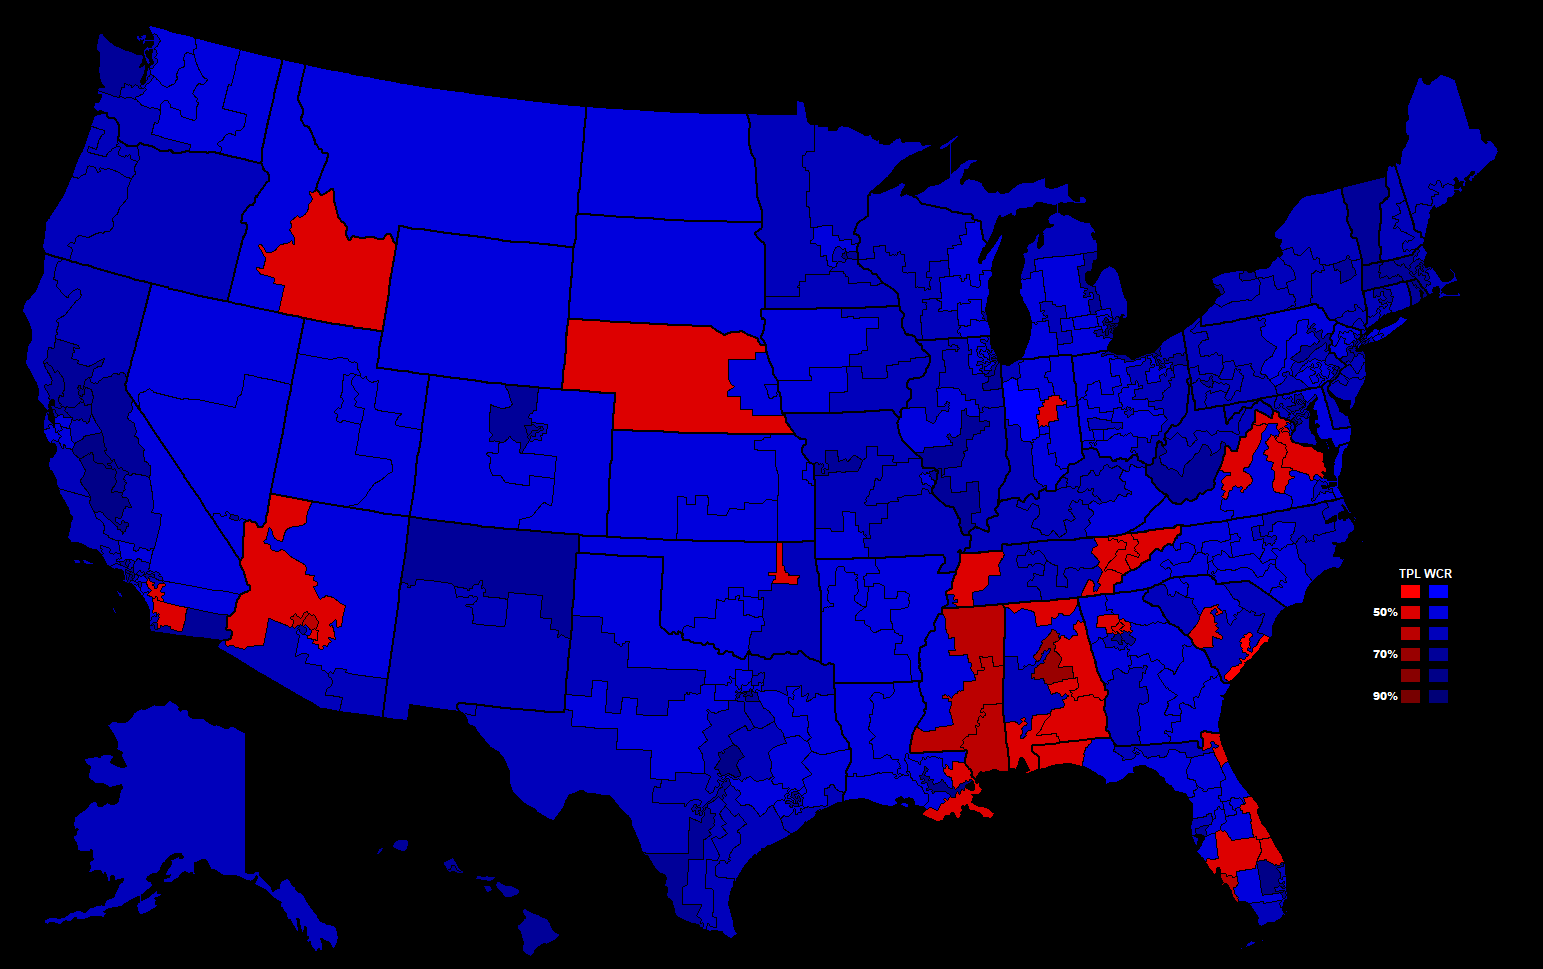
Looks like Leach gets 16 electoral votes. 9 from Alabama, 6 from Mississippi, and 1 from Nebraska.
Yes he does. The election results by state table is here: https://fiction.wikia.com/wiki/Unit...on,_2016_(Alternate_Version)#Results_by_state. I also made some minor modifications in Washington just now, since King County is ~60% Democratic here. At this point, I'm pretty certain that I have the congressional districts, overall, right, in terms of who wins them. It's the percentages that are more difficult to devise, which is why I've also had to continue to make modifications.Looks like Leach gets 16 electoral votes. 9 from Alabama, 6 from Mississippi, and 1 from Nebraska.
What if Nixon had won in 1960?
1960:
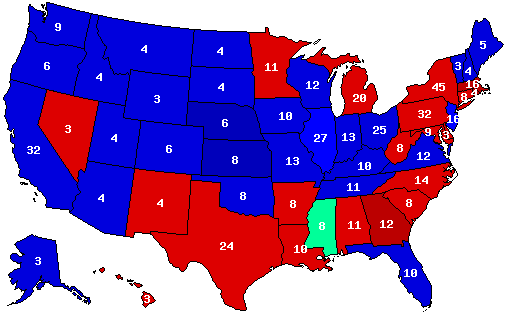
1964:
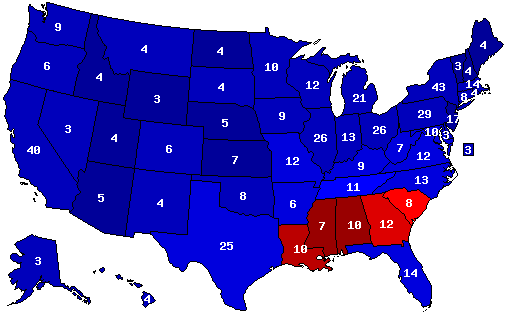
Richard M. Nixon (R-CA)/Spiro Agnew (R-MD) 491 electoral votes, 66% popular vote
George C. Wallace (D-AL)/Happy Chandler (D-KY) 47 electoral votes, 32.5% popular vote
1968:
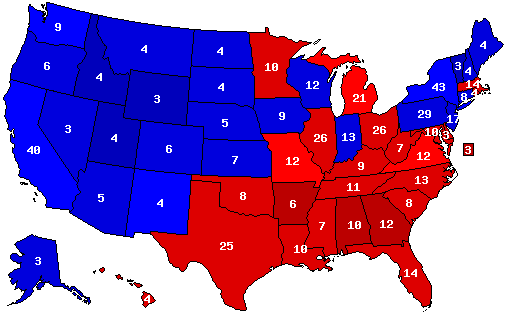
"Big" Jim Folsom (D-AL)/Stephen M. Young (D-OH) 49.8% popular vote, 285 electoral votes
Nelson Rockefeller (R-NY)/William T. Cahill (R-NJ) 49.6% popular vote, 253 electoral votes
1960:
1964:
Richard M. Nixon (R-CA)/Spiro Agnew (R-MD) 491 electoral votes, 66% popular vote
George C. Wallace (D-AL)/Happy Chandler (D-KY) 47 electoral votes, 32.5% popular vote
1968:
"Big" Jim Folsom (D-AL)/Stephen M. Young (D-OH) 49.8% popular vote, 285 electoral votes
Nelson Rockefeller (R-NY)/William T. Cahill (R-NJ) 49.6% popular vote, 253 electoral votes
I assume this is the scenario you suggested earlier, where Nixon pushes through the Civil Rights Act?What if Nixon had won in 1960?
1960:

1964:

Richard M. Nixon (R-CA)/Spiro Agnew (R-MD) 491 electoral votes, 66% popular vote
George C. Wallace (D-AL)/Happy Chandler (D-KY) 47 electoral votes, 32.5% popular vote
1968:

"Big" Jim Folsom (D-AL)/Stephen M. Young (D-OH) 49.8% popular vote, 285 electoral votes
Nelson Rockefeller (R-NY)/William T. Cahill (R-NJ) 49.6% popular vote, 253 electoral votes
I decided to have a go at my own Debs Wins Indiana map.
I transferred 35% of the Democratic vote and 30% of the Progressive vote to the Socialists which results in a disgustingly four cornered race.

Debs/Seidel (Socialist): 215 EV, 28.85%
Wilson/Marshall (Democratic): 173 EV, 27.20%
Taft/Butler (Republican): 138 EV, 23.17%
Roosevelt/Johnson (Progressive): 5 EV, 19.18%
I transferred 35% of the Democratic vote and 30% of the Progressive vote to the Socialists which results in a disgustingly four cornered race.
Debs/Seidel (Socialist): 215 EV, 28.85%
Wilson/Marshall (Democratic): 173 EV, 27.20%
Taft/Butler (Republican): 138 EV, 23.17%
Roosevelt/Johnson (Progressive): 5 EV, 19.18%
Indeed it is. I'll be posting every Presidential election in this timeline from 1972-2016 in the coming days, and probably some county maps later on.I assume this is the scenario you suggested earlier, where Nixon pushes through the Civil Rights Act?
I will be interested in seeing them. Also, as regards your Jason Carter 2014 map from earlier, do you think the Georgia map this year will look similar to that if Abrams manages to win?Indeed it is. I'll be posting every Presidential election in this timeline from 1972-2016 in the coming days, and probably some county maps later on.
I think if Abrams wins, the main differences between her map and the Carter victory map would be that she'll win Cobb and Gwinnett Counties, while losing Telfair and generally doing worse with rural whites than Carter did.I will be interested in seeing them. Also, as regards your Jason Carter 2014 map from earlier, do you think the Georgia map this year will look similar to that if Abrams manages to win?
I decided to have a go at my own Debs Wins Indiana map.
I transferred 35% of the Democratic vote and 30% of the Progressive vote to the Socialists which results in a disgustingly four cornered race.
View attachment 406320
Debs/Seidel (Socialist): 215 EV, 28.85%
Wilson/Marshall (Democratic): 173 EV, 27.20%
Taft/Butler (Republican): 138 EV, 23.17%
Roosevelt/Johnson (Progressive): 5 EV, 19.18%
Strange that he didn't win Florida despite coming second there IRL.
Strange that he didn't win Florida despite coming second there IRL.
He did come second yes, but the Democrats came first with nearly 70% IOTL, so ITTL he only manages to narrow it to a nine point gap.
U.S. with Canadian parties:

American politics has typically been dominated by two parties, the Conservatives and Liberals. Traditionally, the Conservatives were the party of white-collar businessmen, while the Liberals were branded the party of the working man. The Deep South and the West are the cores of the Conservative Party, while the Midwest and Appalachia are the traditional cores of the Liberal Party. The parties have straddled between center and center-left (for Liberals) / center-right (for Conservatives) depending on the party leadership. This two-party system has been usurped by the recent rise of the left-wing New Democratic Party, which has taken hold of urban centers especially in the Northeast and West Coast. The separatist, big-tent Texas Group was once a dominant force in Texas politics, but has lost a lot of influence over the past decade and the Conservatives have emerged as the predominant force in Texas. The Greens can only be found in the most left-wing parts of the country, occasionally proving competitive in races in San Francisco, parts of the Boston area, and Burlington, Vermont.

American politics has typically been dominated by two parties, the Conservatives and Liberals. Traditionally, the Conservatives were the party of white-collar businessmen, while the Liberals were branded the party of the working man. The Deep South and the West are the cores of the Conservative Party, while the Midwest and Appalachia are the traditional cores of the Liberal Party. The parties have straddled between center and center-left (for Liberals) / center-right (for Conservatives) depending on the party leadership. This two-party system has been usurped by the recent rise of the left-wing New Democratic Party, which has taken hold of urban centers especially in the Northeast and West Coast. The separatist, big-tent Texas Group was once a dominant force in Texas politics, but has lost a lot of influence over the past decade and the Conservatives have emerged as the predominant force in Texas. The Greens can only be found in the most left-wing parts of the country, occasionally proving competitive in races in San Francisco, parts of the Boston area, and Burlington, Vermont.
Last edited:
Darn it! Someone took it before I could!Snip
Gentleman Biaggi
Banned
Why would Kennedy pick another northeasterner?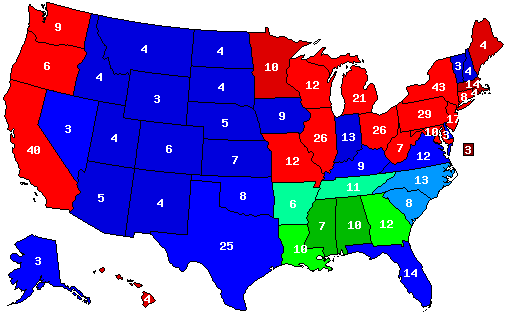
Another alternate 1968
Gov. Robert F. Kennedy(MA)/Sen. Edward Muskie(ME) - 305 EV
Fmr. VP Richard M. Nixon(NY)/Gov. Ted Agnew(MD) - 176 EV
Gov. George Wallace(AL)/Gen. Curtis LeMay(OH) - 57 EV
I wanted to go with Ralph Yarborough (Terry Sanford turned down the Veep nom. in our TL), but I feel he wouldn’t be accepted by the mainstream dems. So Ed Muskie is a compromise.Why would Kennedy pick another northeasterner?
Gentleman Biaggi
Banned
If anything John Connally would be a compromiseI wanted to go with Ralph Yarborough (Terry Sanford turned down the Veep nom. in our TL), but I feel he wouldn’t be accepted by the mainstream dems. So Ed Muskie is a compromise.
Threadmarks
View all 43 threadmarks
Reader mode
Reader mode
Recent threadmarks
Pericles-Obama landslide in 2008 Pericles-Obama does better in 2012 Tex Arkana-Carter runs a better campaign in 1976 and picks Frank Church as his running mate, winning in a landslide. DPKdebator-Trump landslide in 2016 wildviper121-Trump landslide based off of someone's Campaign trail game DPKdebator-The worst you can do as Hillary Clinton in the campaign trail game TheSaint1950-Last gallup poll in 1948 is right jonnguy2016-Trump self-sabotage- Status
- Not open for further replies.
Share:

