Ohio would be the keyOhio?
")
But I think that Keith has better chances.
Ohio would be the keyOhio?
*dixe plays quietly in the backround*In this timeline, Carter easily wins re-election in 1980, and the Democratic party basically returns to its roots as a primarily Southern Party, while the GOP does very well in the North and West. this is what the 2016 Presidential Election looks like in this world, on the county level. I've only finished the South thus far, but I thought I'd post it because it's quite interesting... I'll post the full map when I finish it.

In this timeline, Carter easily wins re-election in 1980, and the Democratic party basically returns to its roots as a primarily Southern Party, while the GOP does very well in the North and West. this is what the 2016 Presidential Election looks like in this world, on the county level. I've only finished the South thus far, but I thought I'd post it because it's quite interesting... I'll post the full map when I finish it.
Who are the candidates?And this would be the state map in a close election:
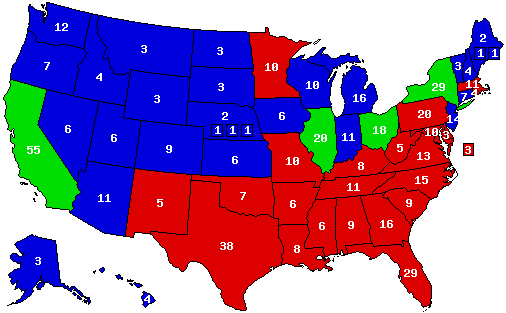
Illinois, California, Ohio, and New York are the deciding states.
In the 2016 scenario, the Democratic ticket is Jim Hood/Deborah Ross and the GOP ticket is Phil Scott/Rick Snyder. my map above is just for a generic close election in this universe though.Who are the candidates?
Reminds me of my old R north / D south map from this summer...In this timeline, Carter easily wins re-election in 1980, and the Democratic party basically returns to its roots as a primarily Southern Party, while the GOP does very well in the North and West. this is what the 2016 Presidential Election looks like in this world, on the county level. I've only finished the South thus far, but I thought I'd post it because it's quite interesting... I'll post the full map when I finish it.


It is somewhat similar, but the actual county map is pretty different.Reminds me of my old R north / D south map from this summer...
Thanks for the suggestions, I make sure to keep them in mind. And as for a world map I haven't thought much about it beyond just the major world powers so I'm not planning on making anything beyond the USA before I finish the vast majority of states at least.Once again WOW!!!
Also, with regards to maps of parties, I don't expect you to make one of every single party, I would never expect that given how much effort is required to produce them. I think that the parties that maps should be made about should be: Greens, Right-Wing parties (Republicans, Constitution, Social Credit, Libertarians, Democrats) and a combined ethnic parties map (Black Panther, Asian Action, Hispanos Unidos, Black Baptist Bloc)
And also, any chance of a world map, as I would be very interested to see what the world looks like in this TL.
I'll take a shot at it as well.View attachment 358562
The 1980 Presidential Election
Progressive Senator John Anderson defeated President Jimmy Carter 39-35 last night, and by a 328-206 margin in the electoral college, the largest progressive win since Dwight Eisenhower's re-election in 1960, with the exception of 1964. Former Vice President Ronald Reagan managed only 24% of the vote, and managed to win only staunchly conservative Utah, the worst republican performance since Nixon's collapse in 1972.
What are the major world powers?Thanks for the suggestions, I make sure to keep them in mind. And as for a world map I haven't thought much about it beyond just the major world powers so I'm not planning on making anything beyond the USA before I finish the vast majority of states at least.
It's pretty telling that I'd vote for a ticket comprised of a 94 year old man and an egg McMuffin over Clinton or Trump, in this scenario.

How do African-Americans and Hispanics vote ITTL?Here's the finished version of my "Carter wins re-election" 2016 county map. This represents a close election, and I plan on doing maps for GOP and Democratic landslides based on this idea as well.
African-Americans are still heavily Democratic, but slightly less so than IOTL. They would normally vote something like 85-15 D in a close election. Hispanics outside of Texas and New Mexico are swing voters, but are heavily Democratic in those two states due to pretty much everyone being heavily Democratic in those states.How do African-Americans and Hispanics vote ITTL?