I'm not exactly a fan of him, but if there's going to be a Republican President in 2020 he'd certainly be one of the better options... although in the extremely unlikely event that he successfully primaried Trump, he'd probably lose the general election in a landslide with Trump running as a third party.I don’t know if this the right place to ask but why are y’all Haslam fans?
You are using an out of date browser. It may not display this or other websites correctly.
You should upgrade or use an alternative browser.
You should upgrade or use an alternative browser.
Alternate Electoral Maps II
- Thread starter Aaaaasima
- Start date
- Status
- Not open for further replies.
Threadmarks
View all 43 threadmarks
Reader mode
Reader mode
Recent threadmarks
Pericles-Obama landslide in 2008 Pericles-Obama does better in 2012 Tex Arkana-Carter runs a better campaign in 1976 and picks Frank Church as his running mate, winning in a landslide. DPKdebator-Trump landslide in 2016 wildviper121-Trump landslide based off of someone's Campaign trail game DPKdebator-The worst you can do as Hillary Clinton in the campaign trail game TheSaint1950-Last gallup poll in 1948 is right jonnguy2016-Trump self-sabotageThis is it! Originally, when I was creating this map, I had the idea that Illinois was a narrow Republican victory, but this actually works better. And your guesses about the state margins are correct. You forgot Wisconsin however, but you are correct in saying that it is a narrow Democratic victory. You also forgot Iowa, which is a Republican landslide. What kinds of coalitions do you think produced these results?My guess as for the individual state margins:
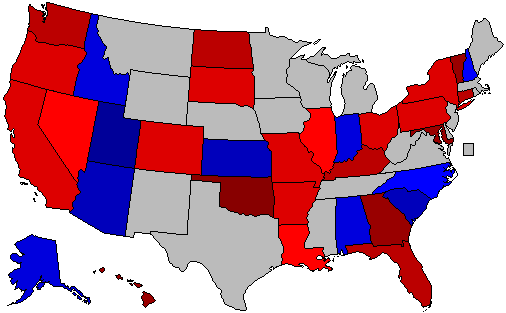
This is it! Originally, when I was creating this map, I had the idea that Illinois was a narrow Republican victory, but this actually works better. And your guesses about the state margins are correct. You forgot Wisconsin however, but you are correct in saying that it is a narrow Democratic victory. You also forgot Iowa, which is a Republican landslide. What kinds of coalitions do you think produced these results?
I'd say something similar to the new deal coalition
It is something similar to that. Of course, there are differences from the New Deal Coalition, as the results in the South and in certain other states (i.e. Vermont) make plain. What would be your guesses as to why these various races turned out the way they did?I'd say something similar to the new deal coalition
I'd say a combination of popular and unpopular incumbents as well as a more populist democratic partyIt is something similar to that. Of course, there are differences from the New Deal Coalition, as the results in the South and in certain other states (i.e. Vermont) make plain. What would be your guesses as to why these various races turned out the way they did?
Zachary VIII
Banned
William McKinley/Garret Hobart (Republican), 324 EV, 48% PV
William Jennings Bryan/Arthur Seawall (Democratic), 48 EV, 33% PV
Grover Cleveland/William Lyne Wilson (National Democrat), 75 EV, 16% PV
The latter part is especially true. I read a scenario on US Election Atlas (called "Between The Majorities"), which postulates that the Democrats return to their populist roots sometime in the near future. This scenario, of course, is based in an alternate 2016, but it's one in which the premises of BTM basically hold true. Democrats are much stronger here on the downballot level than in reality, and were able to successfully craft a coalition of working-class whites and minorities throughout much of the country. In other words, they created a New Deal coalition that is adapted to modern conditions. Republicans, on their part, are stronger among college-educated and suburbanite voters than in our timeline, and have a socially moderate, fiscally conservative platform (similar to those of Dwight Eisenhower and Nelson Rockefeller). They do comparatively better with minority voters, especially Asians and Hispanics. That helps to explain the results in such states as Illinois, California, Pennsylvania, and New York.I'd say a combination of popular and unpopular incumbents as well as a more populist democratic party
Last edited:
I'd flip South Dakota from this map... Missouri, Nevada, Illinois, New Hampshire, and North Carolina could really go either way. Also you forgot to do Wisconsin, but it looks like a narrow Democratic win to me.
I wasn't sure about South Dakota, but when I compared it to other close election results there, a close GOP win made the most sense to me.
I found a map of a close South Dakota race from 1962, when George McGovern won his first term in the Senate, and used that as my template for that state's results in this scenario.I wasn't sure about South Dakota, but when I compared it to other close election results there, a close GOP win made the most sense to me.
Wouldn't it be better if you included the coastal Connecticut counties instead of Hartford County?Pro Trump gerrymander.
View attachment 399736

1980 Primaries from Jus' Doin' My Job
Would this be plausible?
I see. I tried to use the RCP and FiveThirtyEight demographic calculators to get an idea of how the major demographic groups would vote. I had already determined that Rutherford won ~62-37%. I put these numbers into the calculators. Going by them, and keeping in mind that the party coalitions in this scenario resemble those of the 1960s-90s period, Rutherford wins something like 57% of non-college educated whites and 52% of college-educated whites, along with 94% of blacks, 72% of Hispanics, and 69% of Asians. Minority groups, as I explained elsewhere, are majority Democratic, but somewhat less so then they would be in our timeline because of the Republican Party's moderate stances on social issues (akin to the Rockefeller Republicans or the Northern Republicans of the 1960s). College-educated whites, like they were in 1964, are more Republican than non-college educated whites. Do these numbers seem reasonable? And also, based upon the county maps, what would be your guess as to the white vote by state? Alabama and Mississippi are the only states won by Leach, and obviously, whites in those states go Republican.Obviously since it's such a large landslide I'd guess the Democrat wins every major demographic group. If this happened in 2016 I think he'd win whites by a margin of something like 57-40, blacks by a 98-2 margin, Hispanics by an 80-18 margin, and Asians by a similar margin to Hispanics. I think he wins every income class, doing almost equally well with the working class and the wealthy.
Those do seem reasonable. I'd guess that he wins the white vote in every state he wins except for maybe Idaho and Virginia.I see. I tried to use the RCP and FiveThirtyEight demographic calculators to get an idea of how the major demographic groups would vote. I had already determined that Rutherford won ~62-37%. I put these numbers into the calculators. Going by them, and keeping in mind that the party coalitions in this scenario resemble those of the 1960s-90s period, Rutherford wins something like 57% of non-college educated whites and 52% of college-educated whites, along with 94% of blacks, 72% of Hispanics, and 69% of Asians. Minority groups, as I explained elsewhere, are majority Democratic, but somewhat less so then they would be in our timeline because of the Republican Party's moderate stances on social issues (akin to the Rockefeller Republicans or the Northern Republicans of the 1960s). College-educated whites, like they were in 1964, are more Republican than non-college educated whites. Do these numbers seem reasonable? And also, based upon the county maps, what would be your guess as to the white vote by state? Alabama and Mississippi are the only states won by Leach, and obviously, whites in those states go Republican.
Why the doubts about Idaho and Virginia?Those do seem reasonable. I'd guess that he wins the white vote in every state he wins except for maybe Idaho and Virginia.
My first map on here, just a map I feel like would capture the best Trump could realistically do without winning the popular vote. Just giving him Minnesota and New Hampshire. Nothing too big. If he won the popular vote by just a hair, add in Nevada and Maine, if he wins by a big margin, I would give him Colorado and Virginia and if he somehow managed to get a majority (50.1% or higher) I would give him Oregon and New Mexico as well

A Centruy of Chaos part I, the 1916 election:
The 1916 election was possibly the most important election in American history. The Great War was being waged in Europe, and it was a major issue in the election. Democratic nominee Woodrow Wilson and Socialist nominee Alan Benson both declared that they would not go to war if elected, while Republican Charles Evans Hughes ran on a platform of preparing for a potential war. By the end of the election, it was clear that the state of California would be the state that declared the winner as the election was expected to be close. With this, Hughes met with powerful Californian governor Hiram Johnson to recive his endorsement. While Johnson opposed US intervention into the Great War, he decided to endorse Hughes, causing many to predict his win.
View attachment 399966
Woodrow Wilson/Thomas Marshall (Democratic) 261 EVs
Charles Evans Hughes/Charles Fairbanks (Republican) 260 EVs
Alan Benson/George Kirkpatrick (Socialist) 10 EVs
Instead of the predicted Republican victory, the electoral college came out split, as the Socialists narrowly took Oklahoma. After this, the election was thrown into the house. The problem was, the house was completely split. The Republicans had 215 seats, three short of a majority while the Democrats had 210. The Socialists had 5 seats, the Progressives had 4, the Prohibition party had 2, and an Independent was in Congress too. Meanwhile, the senate was very Democratic with 55 Democratic seats, and Thomas Marshall was elected easily and became acting President while congress fell into anarchy. As uncertainty and political chaos fell on the American people, Mexico attacked Arizona, and all forms of isolationism died, as did any thought of Marshall as a placeholder...
Remember, the vote in the house is by state. iOTL, the 1916 House was in the following position. The outgoing house had 25R Majorities, 22D Majorities and 3 split, the incoming house had 24 had Republican Majorities, 22 had Democratic (and allied) majorities, and 2 split.
Threadmarks
View all 43 threadmarks
Reader mode
Reader mode
Recent threadmarks
Pericles-Obama landslide in 2008 Pericles-Obama does better in 2012 Tex Arkana-Carter runs a better campaign in 1976 and picks Frank Church as his running mate, winning in a landslide. DPKdebator-Trump landslide in 2016 wildviper121-Trump landslide based off of someone's Campaign trail game DPKdebator-The worst you can do as Hillary Clinton in the campaign trail game TheSaint1950-Last gallup poll in 1948 is right jonnguy2016-Trump self-sabotage- Status
- Not open for further replies.
Share: