
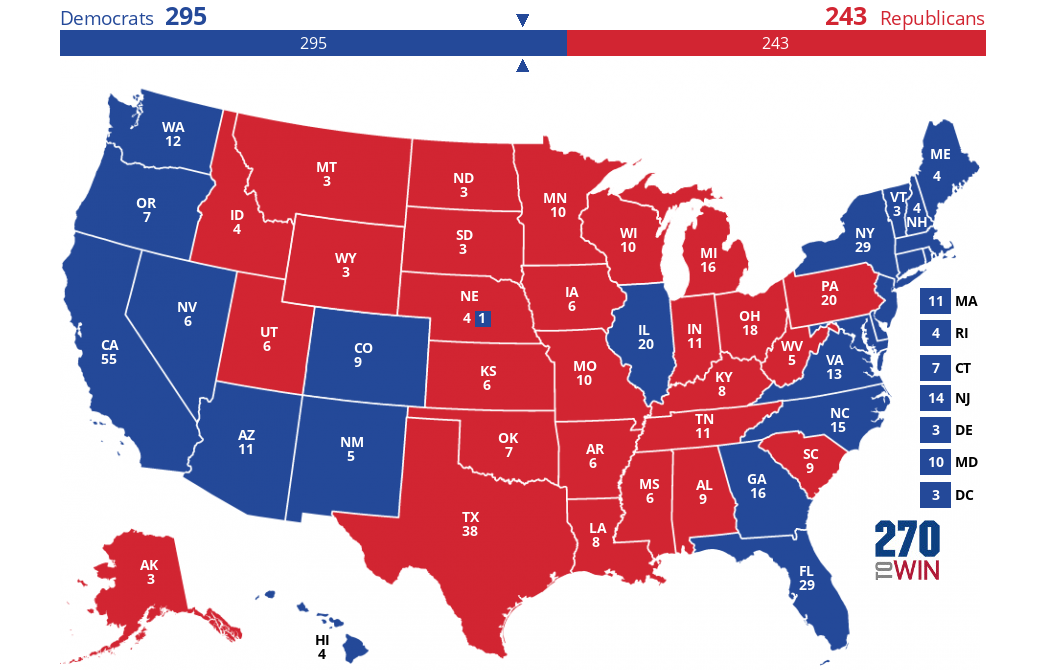
That's not a GOPwank, this is a GOPwank.
This is the map for if Trump is revealed to be the second coming of Christ... Otherwise hell no

That's not a GOPwank, this is a GOPwank.
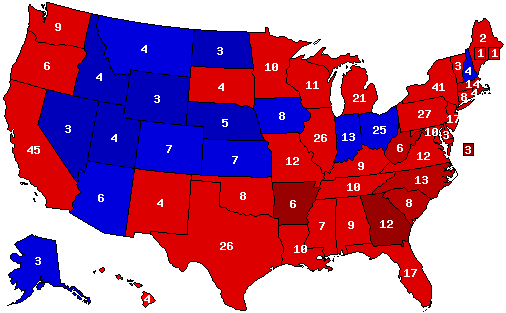
Compromise 2018 midterm scenario.
View attachment 322788
To be honest, this is probably the most likely scenario unless Trump's approval ratings slip farther and drag Senate candidates down with him.
I know this would never happen, but it would be hilarious to see what would happen if Elizabeth Warren lost reelection next year.My personal estimate would be more like 52 Republicans but if Trump is only mildly unpopular this would work.
I don't see how you expect Claire McCaskill, a senator who survived two massive Republican gains, to lose her seat after a full-year Trump debacle.Compromise 2018 midterm scenario.
View attachment 322788
I don't see how you expect Claire McCaskill, a senator who survived two massive Republican gains, to lose her seat after a full-year Trump debacle.
I see what you're saying. Didn't realize she wasn't up for re/election in 2010 and 2014. I still insist that she (and possibly Joe Donnelly) would likely make reelection after the bad name that Trump, Ryan, and the like have started to give the Republicans, along with a boost from probable increased Democratic turnout.What Republican gains? She barely won in 2006, a Democratic wave year, and 2012 was a great year for Democrats too with them gaining 2 more seats(Mitt Romney overperformed the downballot GOP), and even then the big reason she survived is because the GOP nominee was Akin, helped by her ratf***ing of the GOP primary. Since then Missouri has heavily trended to the GOP and Trump won 57% of the vote there. She is vulnerable, but still may survive.

The early polls are right in 1980 and Carter landslides Reagan. This is part of a timeline I'm working on, which culminates in Mondale winning narrowly in 1984 but being crushed in 1988.
I must say, this looks very interesting. I look forward to your TL!

I must say, this looks very interesting. I look forward to your TL!
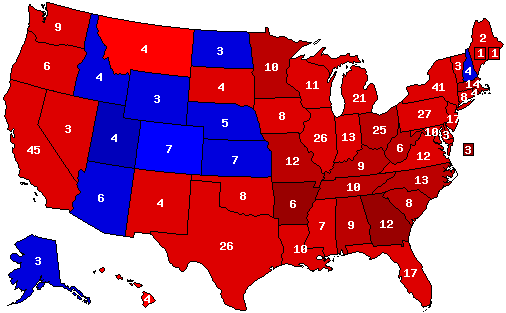
Jimmy Carter/Walter Mondale 492 EV ~ 56% PV
Ronald Reagan/George Bush 46 EV ~ 35% PV
John B. Anderson/Patrick Lucey 0 EV ~ 7% PV
All Others: 1.8% PV ~ 0 EV