Alternate Electoral Maps

Status
Not open for further replies.

Rhad

Banned
This is never going to happen, But...

RgL04.png


Joe Manchin/John Bell Edwards 306 EV ~ 52% PV

Donald Trump/Mike Pence 232 EV ~ 48% PV
My best guess at that would be this map instead
(http://uselectionatlas.org/TOOLS/ge...=1;1;5&NE=2;2;4&NE1=1;1;4&NE2=1;1;5&NE3=2;1;5). Manchin 501 Ev's, 54%, vs. Trump 7 ev's, 39%.
 
A follow-up to my previous hex-map, I really like making these. I only have data going back to 2000, so I guess that is where I will stop.

Also, addressing criticism.

*rubs my face all over liberal Tampa*

Also, that stylization is fucking with my brain. Orlando is directly to the right of Tampa, but both are several blocks above Lakeland!?


Yeah. Minnesota northeast of Wisconsin and Chicago is weird also. It needs a Lake Michigan gap in there somewhere, too.

But I really like the concept of the hex map though.

Several areas ended up quite distorted, due to my poor assumptions on how large/small a city would be. Florida got the worst here because I both assumed Miami would take up a huge weight (it did) but thought the I-4 would naturally fill in what remained (it didn’t). I redid it now giving Tampa and Orlando their own distortion weight on the map, and now what was once one of the ugliest areas improves. Same goes for Lake Michigan, Chicago distorts the area so much that I thought it might be better to remove the lake. I guess that was wrong. Oh, and that is not Minnesota, that’s Superior which is why the state is on top of Wisconsin.

As I am making the 2000 era district hex map, I am trying to correct for distortions to prevent huge inaccuracies from forming.

I love your map and it's really well done and I love the concept-but I know Mansfield and Wooster-Mansfield is more likely to go to a left wing party and there's no way Wooster would go to a labor party

Wooster and Mansfield. Here we get into the weird naming criteria I set forward. A name should reflect the general geographic area of a district, its population centers, and the societal links in the region. Unfortunately, some areas are left out of names. Mansfield is a tossup city in Ohio; however, the district gets its partisan lean from OTL Rural Conservative Crawford and Wyandot. Meanwhile, Wooster is the Geographic epicenter of its district. However, the district includes about a third of overwhelmingly Labour OTL Stark County (most of the land west of Canton and suburbs) plus the little jut out of OTL Summit that in TTL never was part of West Connecticut. That area is also strong Labour. This gives the district a Lean Labour streak – if the Tories had won a good 15 more districts, Wooster would have fallen.

--------------------------------​

The 2011 Columbian General election came six years after the 2005 economic slowdown and five years after the overwhelming landslide loss of the Whig Majority. In the place of the Liberal Whigs rose both Labour and the Conservatives, each profiting off their own plans for solving economic crisis. It was Labour though, who won a plurality of seats to form the ruling minority government.

The 2011 campaign was therefore marketed as a head-to-head Tory verses Labour standoff. The ruling Labour government had been unable to put in place many of their more partisan proposals, fearing a vote of no confidence. Therefore, many expected the less-than-popular government to fall.

However, the race did not want to be a two party contest. The Whigs, reformed from the ashes of their defeat came roaring back, championing their successes of the Long Liberal era and attacking the two larger parties as unable to solve the crisis as proven by the incompetence of the minority governments. While Labour fended off the Whig attacks, the Tories were caught off guard in many constituencies as some of their 2006 voters returned to their traditional base. After a lackluster debate, the Conservatives fell in the polling never to challenge Labour for the rest of the campaign.

Adding to the uncertainty was the new constituencies. The boundary commission produced its report and maps in 2010, and the changes followed a similar pattern to the past years. 14 constituencies migrated from the Labour dominated Northwest to the Conservative South. Despite polling indicating a Labour landslide, there were questions about whether under the new lines the party would win a majority or just fall short.

nZzLdSm.png

In the end, Labour barely added to their total 2011 vote share. Instead, the swing from the Conservative to the Whigs lowered the margin required for victory in many marginal seats. Labour would head to Manhattan with a seven-seat majority.

Columbia, A More British America
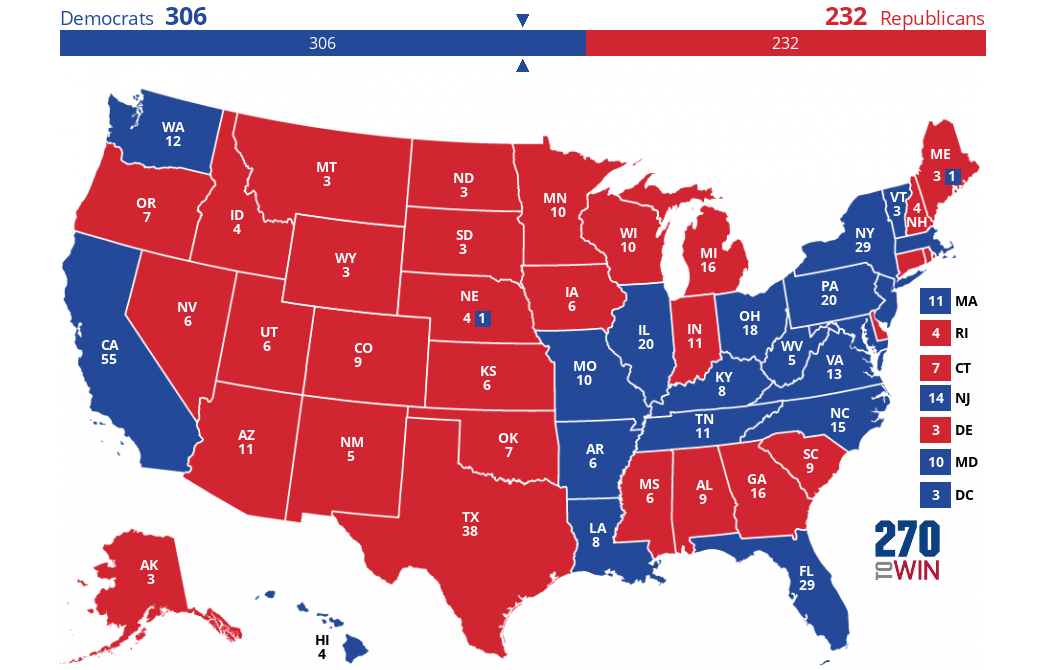
2016 General Election Hex Map, Provided by CNBC
 
Last edited:
How do the Rural Citizens win Memphis and half of metro Atlanta?

Going off on a limb here, but I've encountered a lot of people who self-identify with the 'country' subculture, or at least romanticize rural life along those lines.
I haven't read the AH in question, but let's stay there was urban migration from rural areas, and those migrants feel alienated by urban politics or identify strongly with their rural heritage.
 
Same goes for Lake Michigan, Chicago distorts the area so much that I thought it might be better to remove the lake. I guess that was wrong. Oh, and that is not Minnesota, that’s Superior which is why the state is on top of Wisconsin.

The version with a Lake Michigan gap is much better. That said, with much of Superior taking up OTL's Northern Wisconsin and NE Minnesota (and one lonely hex for the UP), I'd recommend making *Southern Wisconsin taller/skinnier, with Superior draped over its north and northwest sides. It will feel more geographically accurate.


.
 
My best guess at that would be this map instead
(http://uselectionatlas.org/TOOLS/ge...=1;1;5&NE=2;2;4&NE1=1;1;4&NE2=1;1;5&NE3=2;1;5). Manchin 501 Ev's, 54%, vs. Trump 7 ev's, 39%.

MUZvRoa.jpg


I did 4 states just to illustrate how I'd expect Manchin to perform in Appalachia. I decided to do varying colors based on margin to make it more interesting. this uses the traditional red = GOP, blue = Democrat color scheme. the lightest shades are counties that were won with less than 50% of the vote, while the darkest shades are for counties that were won with more than 80% of the vote.
 

Rhad

Banned
That's not implausible, actually. I think Manchin would win Kentucky with at least 50% of the vote though, he's the ideal candidate for coal country, even more so than Trump.
I think he'd get a majority in a re-election campaign, but two decades of mistrust against democrats are not going to vanish so quick.
 
10% swing towards Jimmy Carter in Oklahoma in 1976 (-5% from Ford and +5% to Carter)


RJ41BxA.jpg


This was well within the realm of possibility if Carter had ran a better campaign and done better in the debates. I'll also do a map like this for Virginia and maybe a couple other states that were really close.

How do you isolate one state in mapchart.net?
 
MUZvRoa.jpg


I did 4 states just to illustrate how I'd expect Manchin to perform in Appalachia. I decided to do varying colors based on margin to make it more interesting. this uses the traditional red = GOP, blue = Democrat color scheme. the lightest shades are counties that were won with less than 50% of the vote, while the darkest shades are for counties that were won with more than 80% of the vote.

With all due respect, what happened in Lackawanna County (Scranton)? Manchin seems to have done really badly there, even losing the county. That just seems a little surprising, especially in a Democratic landslide.
 

Deleted member 83898

genusmap.php


My attempt at re-creating the 1980 presidential election from Rumsfeldia (w/r/t the electoral map/votes, not necessarily the candidates) in a modern setting.

I imagine that going into Election Day about half of the map would be tossup states; this election would probably be regarded as a realigning election.

Gov. Phil Scott/Gov. Brian Sandoval (GOP-VT/NV) - 299 EV, 40.33% PV

Sen. Joe Manchin III/Gov. Brian Schweitzer (DEM-WV/MT) - 232 EV, 42.7% PV

Delegate Eleanor Holmes Norton/Rep. Tulsi Gabbard (RESIST-DC/HI), - 7 EV, 13.8% PV
 
With all due respect, what happened in Lackawanna County (Scranton)? Manchin seems to have done really badly there, even losing the county. That just seems a little surprising, especially in a Democratic landslide.

My bad, I meant to color it blue. otherwise I think this map is pretty accurate though, maybe I'm being a bit too generous to Manchin in Kentucky though.
 
My bad, I meant to color it blue. otherwise I think this map is pretty accurate though, maybe I'm being a bit too generous to Manchin in Kentucky though.

A little, though you cannot underestimate the power of voters thinking the candidate is "one of them". Even when this isn't true, like for Trump this time out, it can deliver huge victories.
 
A little, though you cannot underestimate the power of voters thinking the candidate is "one of them". Even when this isn't true, like for Trump this time out, it can deliver huge victories.

Yes, I'd expect Manchin to run up huge margins in Appalachia, although maybe he'd do slightly worse in the more urban areas of Kentucky. I have no doubt Manchin would win West Virginia by ~30% and crush Trump in Virginia though.
 
Top
Status
Not open for further replies.
Top