Colorado is a state in the Mountain West region of the United States that encompasses a large region featuring rolling plains all the way up to Pike's Peak which is, at 4,302m, the highest point in the "Lower 48" United States (that is, all US states not including Alaska or Hawaii). The state, while quite large—10% larger than the UK and 1/3 the size of Germany—is sparsely populated, home to around 5.6 million people. The bulk of these people are concentrated in an area known as the "Front Range", a series of metro areas running up the edge of the Rocky Mountains between the mountains themselves and the empty plains further east. The largest cities/metro areas on the Front Range are Denver (metro population 2,853,077), Colorado Springs (metro population 712,327), Fort Collins (metro population 339,993), Boulder (metro population 322,226), Greeley (metro population 294,932), and Pueblo (165,123). In recent years, the Denver area in particular has seen a large population boom, with suburban cities within the metro area such as Aurora, Arvada, Lakewood, Westminster, and Centennial growing to over 100,000 residents and becoming cities of their own, while still dependent on Denver itself as an anchor. Outside of the Front Range, Colorado has few cities but many smaller towns, from farming towns in the east to famed ski towns in the west, perhaps more than any other Aspen.
Politically, Colorado between the 1964 Presidential election, in which it—like most other American states—went to Lyndon B. Johnson in a landslide, and the 1992 election was typically a Republican state on the Presidential level, and after the 1962 elections until well into the 2000s Republicans would dominate the Colorado Senate and House of Representatives. However, after the 1970s Democrats would come to typically control the position of Governor (since 1975, Colorado has had only 1 Republican Governor, Bill Owens) and trade back and forth on the positions of Attorney General and State Treasurer. In Congressional elections, Colorado would also remain competitive between Democrats and Republicans for the state's House of Representative seats and 2 senate seats. This gave the state an impression of a more libertarian and free-wheeling Western-style Republican state rather than those of the east, particularly when mixed with the hardcore liberal outposts in places such as Boulder. The state also was one in which third party popularity was higher than back east; in 1980, Independent candidate for President John B. Anderson received 11.03% of the vote in Colorado, his 6th highest statewide performance in the election—a trend which continues to this day as 36.5% of Colorado voters do not identify with either major US party, compared to 31.0% identifying as Democratic and 30.9% Republican.
Third-party votes would, in fact, be what would give an election in Colorado to Democrats for the first time since 1968 in the 1992 Presidential election, when Independent candidate Ross Perot received 23.3% of the vote and thus allowed Democratic nominee Bill Clinton to carry the state with 40.1% of the vote to then-President George H.W. Bush's 35.9%. While President Bill Clinton would proceed to lose the state in 1996 to Republican nominee Bob Dole in a 45.8-44.4 squeaker result (Ross Perot and his Reform Party received only 6.59% of the vote this time), the chance of a Democrat to win the state had been tested. Since then, Colorado would go on to be won narrowly by President George W. Bush in 2000 and 2004, but changing demographics, shifting political attitudes in the state, and political reorganization caused Colorado to vote twice for President Barack Obama in 2008 and 2012 and to vote for Democratic nominee Hillary Clinton in 2016. 2016, though, would mark the first time since 1996 in which Colorado at the Presidential level would note vote for either nominee for more than 50%, instead voting for Democratic nominee Hillary Clinton at 48.2%, Republican nominee (and subsequent President) Donald Trump at 43.3%, and Libertarian Party nominee Gary Johnson at 5.2%.
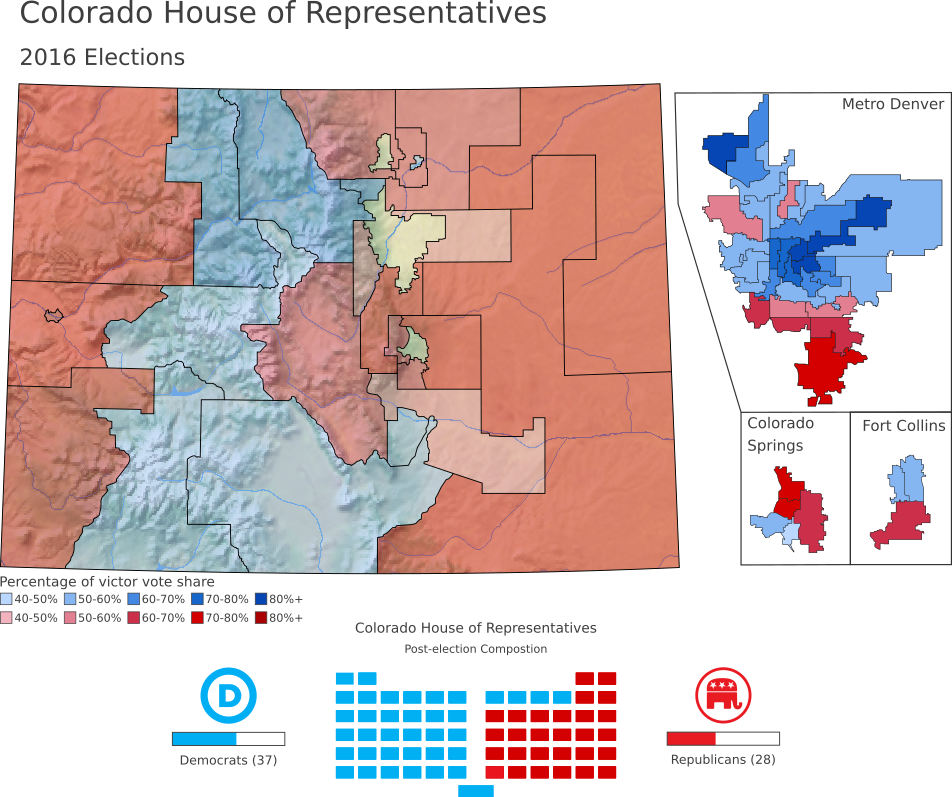
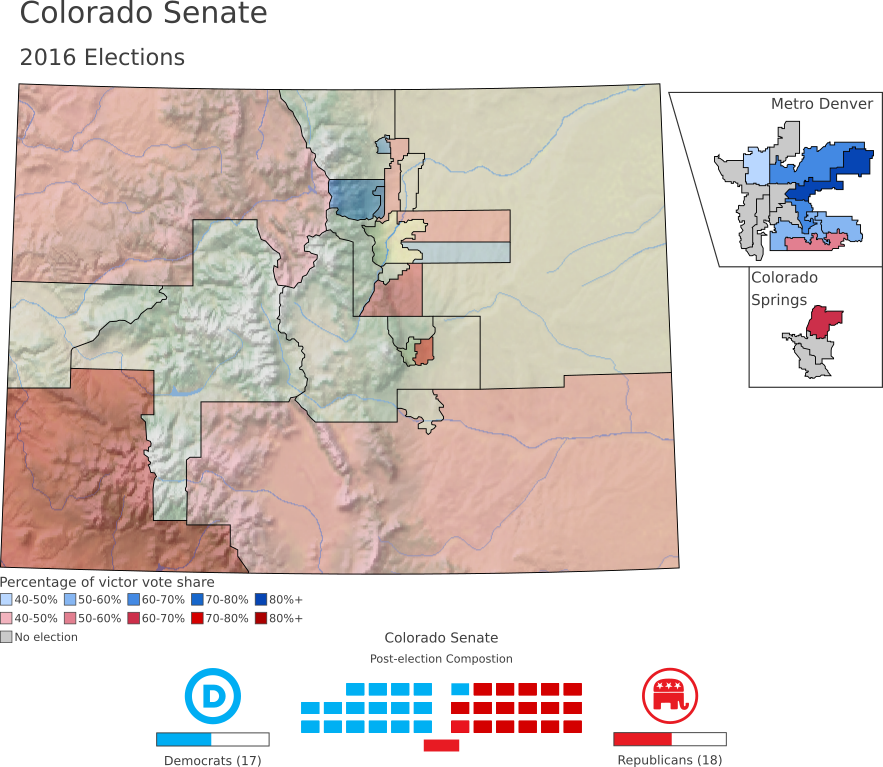
For the 2016 Colorado General Assembly elections, in which all 65 House seats and 18 Senate seats were up for election, Democrats and Republicans were both expected to put up quite a fight. Since gaining control of the General Assembly for the first time since the 1962 elections after the 2004 legislature elections, Democrats had lost control of the Colorado Senate in the 2014 Republican midterm wave and their lead in the House of Representatives had narrowed from 37D-28R to 34D-31R. While Democratic nominee John Hickenlooper had managed to win a difficult gubernatorial election for the Governor's mansion in 2014, a Republican victory enough to take control of the House of Representatives and thus the General Assembly would leave the state's Republican Party in a much stronger position, returning it to its pre-2004 form, more or less. Democrats, meanwhile, hoped that by flipping 1 Senate seat they could flip the narrow 1-seat lead the Republicans maintained in the Colorado Senate, 18R-17D, to win a trifecta control of the state government and allow for a greater range of powers over the state government.
In the end, neither scenario ended up happening. The Republican control of the Colorado Senate continued at its narrow 1-seat lead, while the Democrats would go on to gain back lost seats in the House of Representatives, putting them at 37 seats to the Republicans' 28 once more. Thus, the same equilibrium since after the 2014 elections was maintained for another two years until 2018, in which both parties in the mid terms will once more try and see who might control the Colorado General Assembly and the future of the great state of Colorado.

")