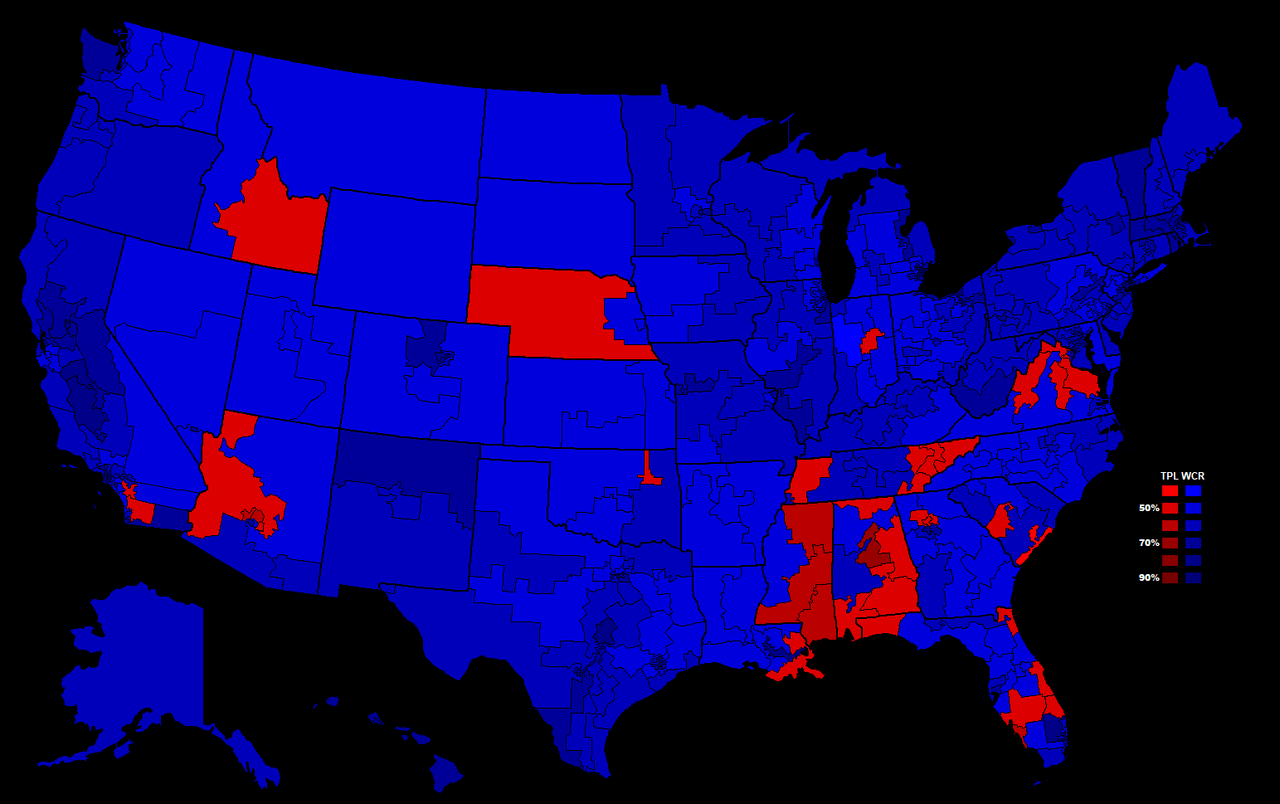
The bigger factor isn't the margin actually...it's the distribution of votes. Case in point - Florida.
You're right. I made some minor edits to the post, realizing that Leach actually won five districts each in Alabama and in Florida. Florida goes Democratic here by a margin of 56-43%, which is about the same margin as in Louisiana, Indiana, Arkansas, North Carolina, South Carolina, Virginia, and Wyoming, on this map. And yet, Rutherford wins all but one district in Louisiana, Indiana, and North Carolina, all but two in Virginia, and sweeps both Wyoming (obviously) and Arkansas. Yet there are five Leach districts in Florida. And you made a good case as to why Leach would win those two districts in Illinois. So distribution of votes definitely does matter.
I have some other questions for you. I've made a rough table of what the vote by demographic would look like (
https://fiction.wikia.com/wiki/Unit...ternate_Version)#Results_by_demographic_group), but I'm somewhat unsure. What do you think the demographic coalitions would look like here? I was envisioning this map to be in an alternate timeline in which the New Deal Coalition survives, in a modified form, into the modern day, and the Republicans have somewhat of an Eisenhower-Rockefeller-Nixon-Ford type coalition of rural, exurban, suburban, and some urban voters built up. Would this map reflect that? What would the vote by demographic look like? I surmised that Rutherford wins ~55% of whites, ~94% of blacks, ~72% of Hispanics, ~69% of Asians, and ~60% of others.