Sojourner85's Exhaustive QGIS Tutorial

Introduction & Master Document
Hello all,

I'm a bit new to this site, so forgive me if this thread is in the wrong spot, but I'm working on creating an exhaustive yet easily-accessible QGIS tutorial in regards to all different sorts of fictional cartography. Most of the images in this thread will be screenshots of mapmaking software, not completed maps, so I hope that's okay.

The reason I'm posting a (currently) unfinished tutorial is because I am the sort of person who highly values community feedback. My tutorial is meant to appeal to every skill level, whether you've used QGIS for 5 years or you've never even heard of QGIS, you can find your specific lesson and start from there.

Anywho, I'll be threadmarking all the lessons and the master document for easy access, questions/comments/suggestions/critique from the community are all very much welcome. I hope that you all enjoy this and hopefully learn something new from it.

Without further ado, the master document.
 
Introduction II(?)
Hi, I’m Troy McClure Sojourner85, and you may know me from such... yada yada, I digress.

I’m here because I love mapmaking, I love the program QGIS, and I love helping my fellow mapmakers improve their craft. Naturally, the conjunction of these loves is an exhaustive mapmaking tutorial for the QGIS program. I was inspired to create this by poking around the Imaginary Maps Discord server and hearing fellow users’ woes, some of which included things like “Tracing rivers sucks!,” “This is so time-consuming,” or my favorite, “Topography is so hard to draw!”

These are all valid concerns for people using entry level raster or vector image editing software, but QGIS acts as a veritable wormhole, that’s how helpful it is at doing these things (and so much more!)

So, without further ado, I cordially invite you to join me as we venture into the wormhole.
 
Lesson 0: The Bare-Bones Basics
Woah, that was… a lot of words you just threw at me.
Yep, but trust me, I can explain it all for you.

First off - mapmaking? I thought that we had already made maps of everything, what with the technology we have nowadays.
That’s correct, but this tutorial is geared primarily at fictional (and occasionally real-life) mapmaking. With QGIS, you can create everything from accurate maps of real places (such as Afghanistan by Ernacius on DeviantArt) to incredibly detailed immersive maps of fictional “alternate history” scenarios (such as [RTL] The World of Roses, Tulips, & Liberty - 1895 : r/imaginarymaps)

I’ll admit that’s interesting, but what’s the stuff in the introduction - what even is a “QGIS”?
Great question! QGIS (Quantum Geographic Information Software) is a completely free computer software that can work with both raster (think pixels, like Super Mario Bros.) and vector (think lines, like Asteroids) files to create high-quality maps while being relatively easy to work with.

That sounds complicated already, I think I’ll stick with tracing.
I understand that it does sound complicated, yes, and when you open QGIS for the first time it looks like a lot to handle. However, I guarantee that the time you invest into learning QGIS will more than make up for all the tracing time that you’ll save by learning this stuff.

Wait, I have more questions!
Just contact me at Sojourner85 on alternatehistory.com if you have more things you’d like me to add to this tutorial.
 
Last edited:
Lesson 1: The Beginning
As we move on to the “meat” of the tutorial, it helps to keep a reward-focused mindset from here on out - any progress is good progress, no matter how small it seems. Something something journey, something something thousand steps, eh?

1.1 - Downloading QGIS
To download QGIS, visit https://qgis.org/en/site/forusers/download.html and download whichever version says “Long term release (most stable):” at the time of this writing, that means 3.22, but that’s subject to change as time goes on.
_j6pzYXyqGH7menSu84p_2FxALkLB7eMeVD3Ax7ZDY9O7EJkRm9mJGnMuJK7W7wANeX3HL1fF5nRVa6q8xA5XPuFx4N7owaC6UspcErTOcaisWywgsJriFDOqgDwL8i7zh_AfCDj

As a disclaimer - this tutorial will feature screenshots from my macOS version of QGIS 3.22, but it looks nearly identical to a Windows version of QGIS, so hopefully there shouldn’t be too many issues there.


1.2 - Opening QGIS
ZdRoowYybJ9vD9qNCKQZzt3TH7MfcAXD3VxMXJR722HM2Mmd6CqTbiMh7CUENKVyi4jPuRYubPf1ukNvsiADpqg1goCwpqClhKEsOaI16hrMqNON0-MiPogIwXeGjaNq5vYEswil

This is what appears for me upon opening QGIS, and something similar should appear for your screen too. Like I promised - it’s honestly a mess. There’s several dozen buttons up top, half of them blanked out, you don’t know what’s going on - but hey, nor did I, and now I’m making a tutorial.

So, given this seemingly-inoperable jumble, I find that the best thing to do is to start simple - let’s just create a new file.


1.3 - Creating a QGIS Project File
ThLYSHGDq12lptqNGf-DrPdHo5HS3Pj5OB5DKcGYGnGor8vwnBvtXmfQZ-71edbryZp7AUlEo86O6VvWtQ0LStKjkngOo9MQRVfVHyqfzzWeji_oGmmfaQgPVyHQEk6g9N8ZJJg5


Go to your “Project” tab up top and then click “New.” There you go, you now have a QGIS project file!
iTHoe9Mn_NEhEr0rbhbiLGedeB5vt7BYxij7hcCWzQDCZUiCT8DpRInJCJRMYJBKMdQnbS_-Erk9IEAJPmyxxdEW_eHrfBxEUNlXiwfMNfbisidWLQo36QEiPErWYHsoS-laDaDY

If you have a blank rectangle here, congrats! You’ve done it perfectly. So, with your new project file in hand, it’s time to add some cool stuff.


1.4 - Adding Shapefiles to your Project FIle
Before I go further, I want to explain what a shapefile (.shp) is - it’s a specific type of file that you can simply drag and drop into QGIS and it will load in certain data for you. What sort of data QGIS depends on what sort of shapefile you give it, there are shapefiles for just about anything and everything map-related you can imagine.

We’ll be using some shapefiles from https://www.naturalearthdata.com/downloads/ for this section of the tutorial.
DJekWaCi0XurOgIcppKSJ_38OyYUs4G3XYZTJmfjm8FLZqUpzqAscKBN_zQpXK43fmJkIa89firHpVI6eAn9by8hLj8Sg8djyY-U00U6J46UnNVEcU2CxBYC7af-w791JqDKZUMG

We’ll be using the 1:10m data found on the left-hand side of the webpage here. Click the green “Physical” button and it will take you to this page:
sR97RTYsgpESVp0ZlgtizIj9Byk1OtfTzV-MBOcACc0Tl4yWmkCJHuVaPlZ0W8ccrpDOBVvJ4jQnf205Oz8L641hqduuijx05dqq2jly-fBdVIBRRrWa4FAW2wIMAF37UXiAKUyx

Just click “Download coastline” for now, it will download a file named “ne_10m_coastline.zip” to your computer. Unzip the file and it’ll show you a folder with a few items:
fL_COGl14ivZjwsR7nmcrwd2W3d-PPsVCUkawgdYn8CdTsdeyMkMHQfxVGivP3DLFVFNNIn1gPOE1Ie8YnZc_byDkpUlXzjeU33DoJDE6By5TuWJCENW60klAqXNQ4rgO8yTd_8m

We only care about “ne_10m_coastline.shp” in this case. Go ahead and drag/drop that file icon into your QGIS icon.
6OXpaRyJrdhxUlL7xZnnvI-sJayuMT6rKZIIQtKgnRqS3LKCXaIjefbLE10BkZSsqzOI7TFduje1krLz81EH9--EQuipOm80RwuDsxQErOj2gx37HV8p8tQ4lgbRE1IIncEbJKjW

Woah! It’s not boring and gross anymore! Way to go, unnamed tutorial guinea pig valued reader!

1.5 - Homework #1
 
Last edited:
Lesson 2: QGIS Controls
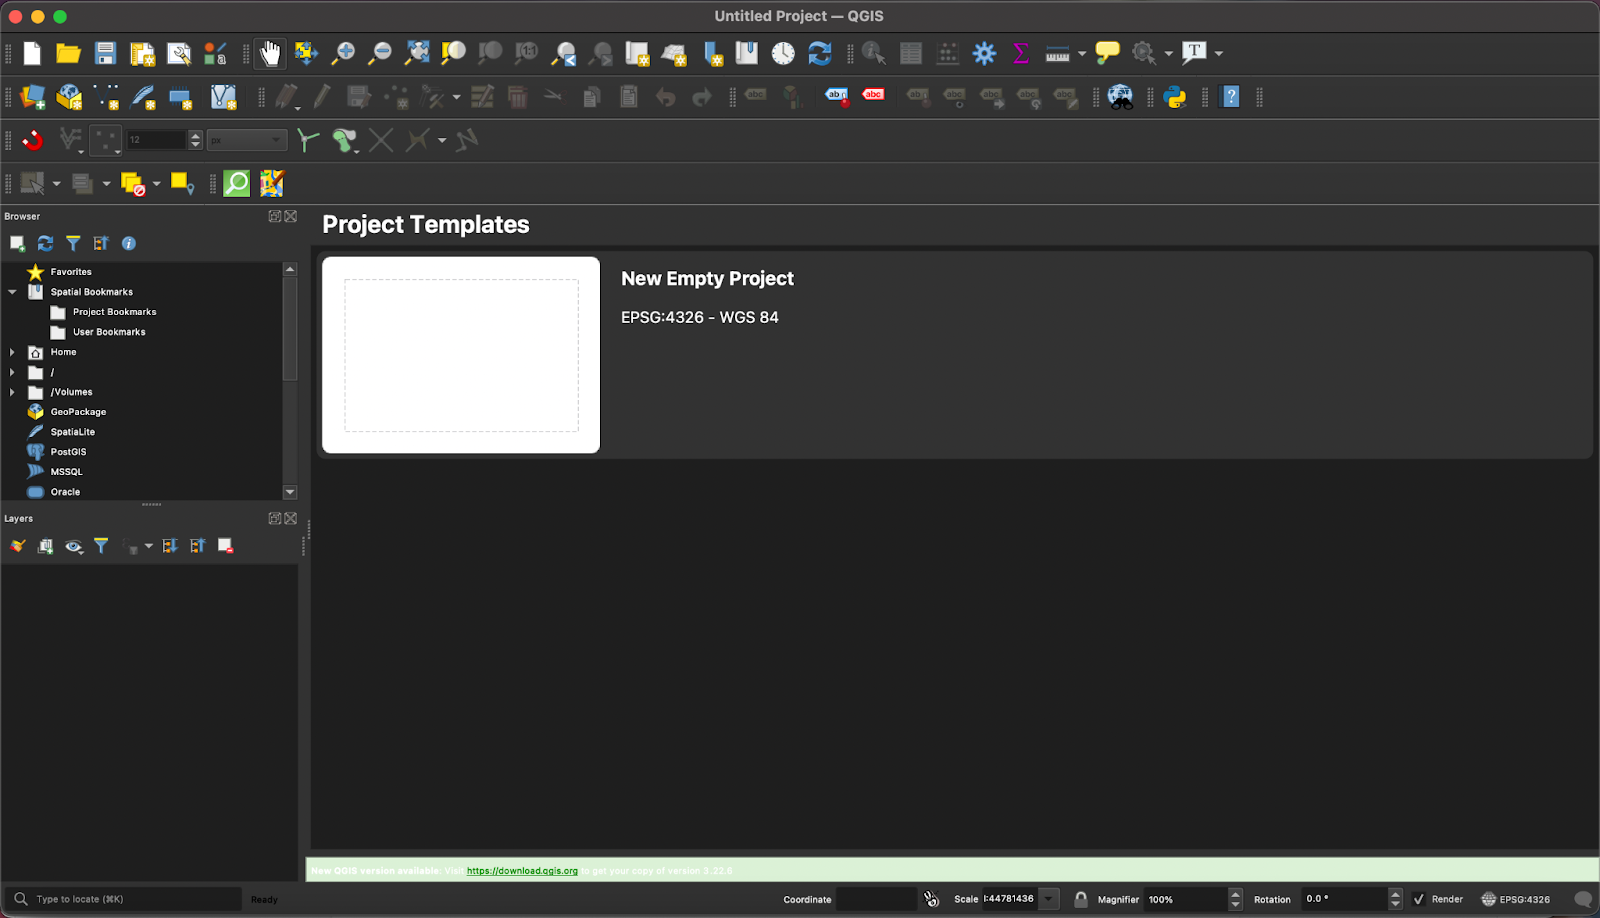
Well, if you’ve made it this far, you’ve downloaded QGIS and you have a project file opened. Well done! You’ve made it farther than >90% of all fictional mapmakers! Now that you’ve got a shapefile on your project file, it’s time to learn some things you can do with it.
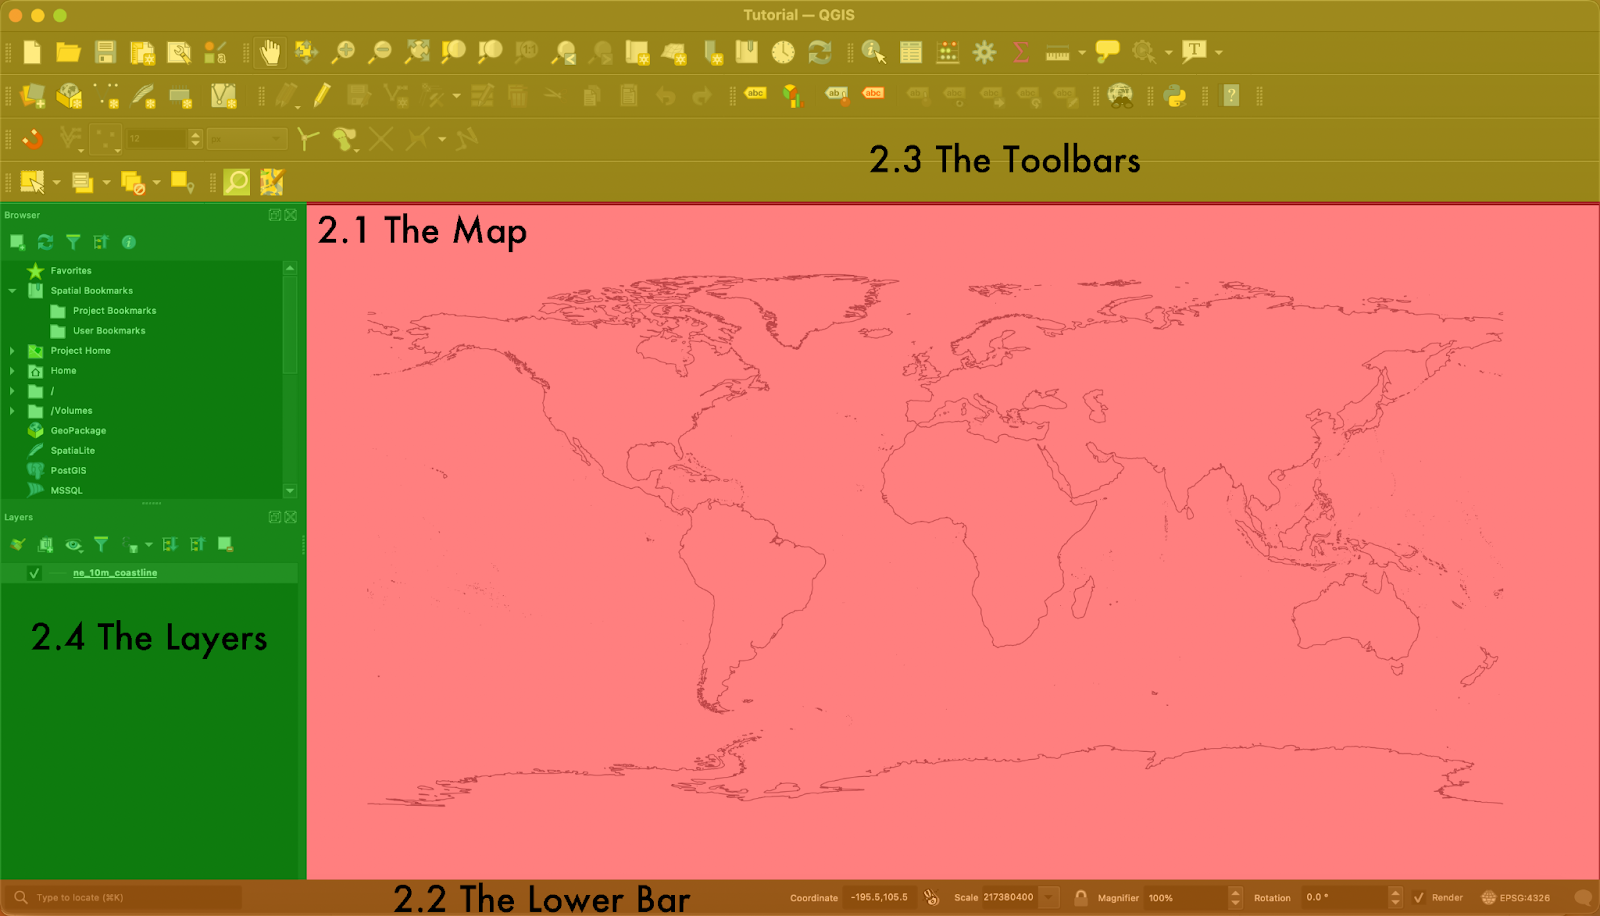
7kVOxoz6BWqPiga8f3Xe0vqFo-yh8LkBbEUtFdq_k2Df4AKhvsNk-HD1B_CE6CkgNqpU-apQUoXgHk1O74jykdv7UOr8uIsnWudqLK9C3YVudgb-GwZIrqvOeyEoIk_DvRnQ3tBHrUTZ-Cl1KA
wg05mtQ0s2AB182mSyoCZ-3AXcK9Xa8qrdcis2k3Y4ycWDdDOEPY_vRSWPGYLmHtKyL8E8yG9ulq4VHrjwPV-JdDdldRNewxmUBDPSGNvVCwhT_Tovr7NkwVD9ulqZF06mgF48bk


2.1 - The Map
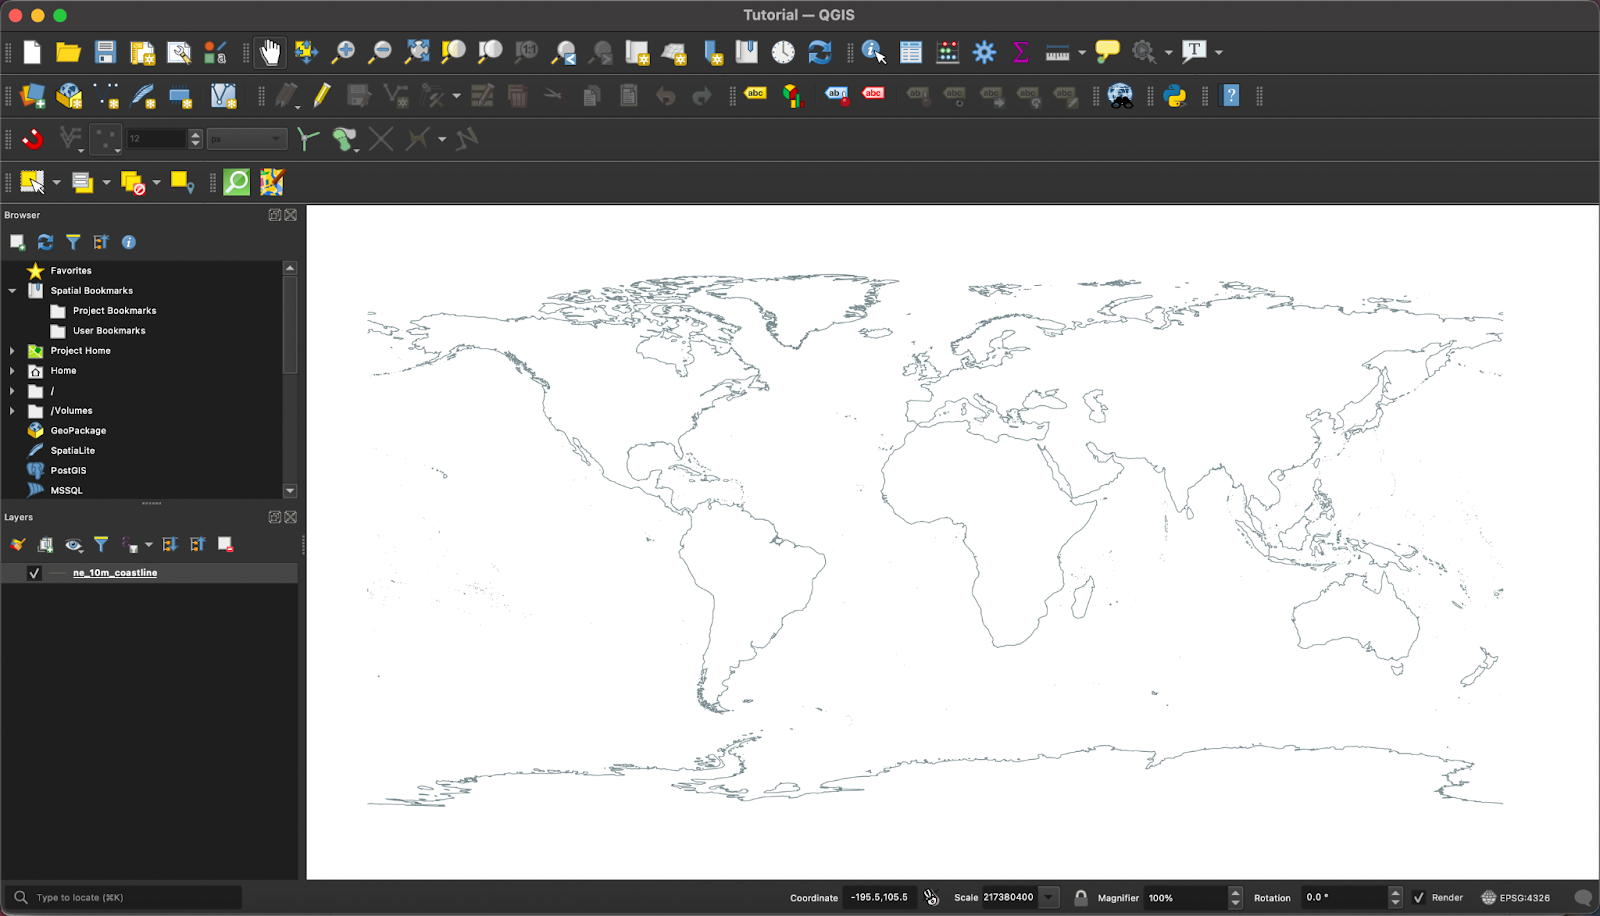
If you remember back to 1.4, we only added one shapefile to our project file, and that’s what the map is currently showing us. It can be zoomed and manipulated by a trackpad or by a scroll wheel, thereby making it very easy to see both the big picture and the minute details of your project file. However, just zooming in and out is boring, let’s go into some fun stuff you can do to your map.

2.2 - The Lower Bar
Going from left to right across the Lower Bar, you’ll notice a few different features, the first one being a search bar with the words “Type to locate.” I’ll be real with you here, I have no clue what that does, you can probably just ignore it.
Next on the list is fairly straightforward - the Coordinates field. This field shows you the latitude and longitude of your mouse cursor and updates in real-time, very helpful for getting a feel of Earth’s coordinate system.
Going to the right, you’ll see the Scale field next. This field simply tells you how “zoomed-in” your map is, and this field actually changes not only when you zoom around the map, but also when you resize your QGIS tab - try it out! For example, a Scale field value of 1:1,000,000 means that every inch of map on your computer screen represents 1,000,000 inches (about 15.8 miles!) of real-world terrain.
Next up, we have the Magnifier field. This one magnifies the map without changing the Scale, which honestly isn’t really all that useful - I generally ignore the Magnifier field.
The Rotation field does exactly what it says on the tin, you get the picture.
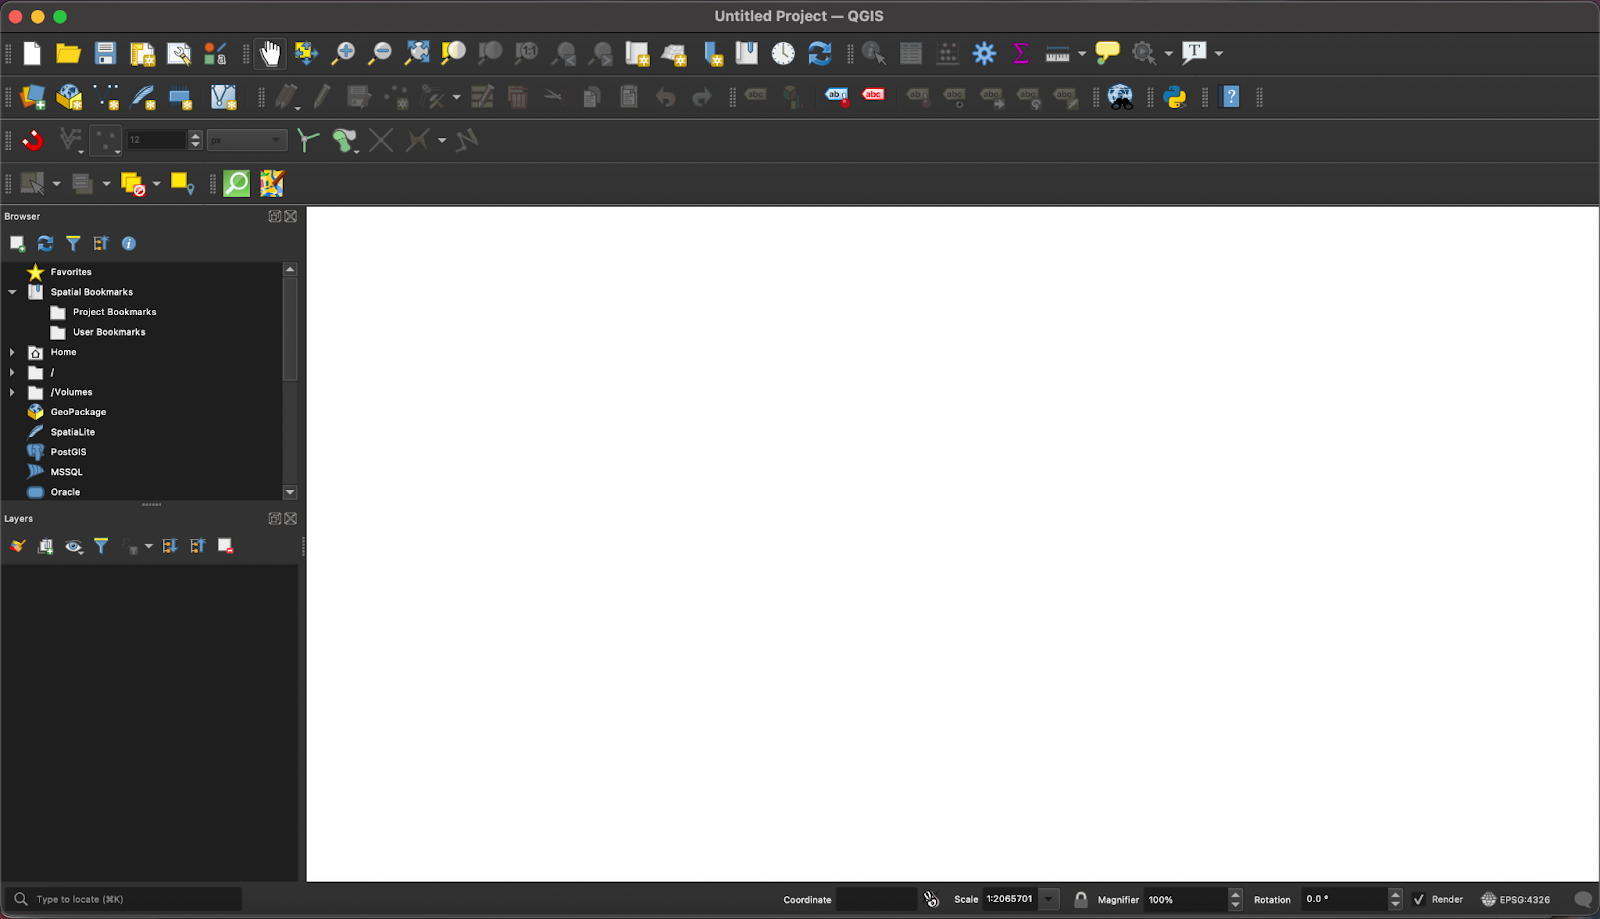
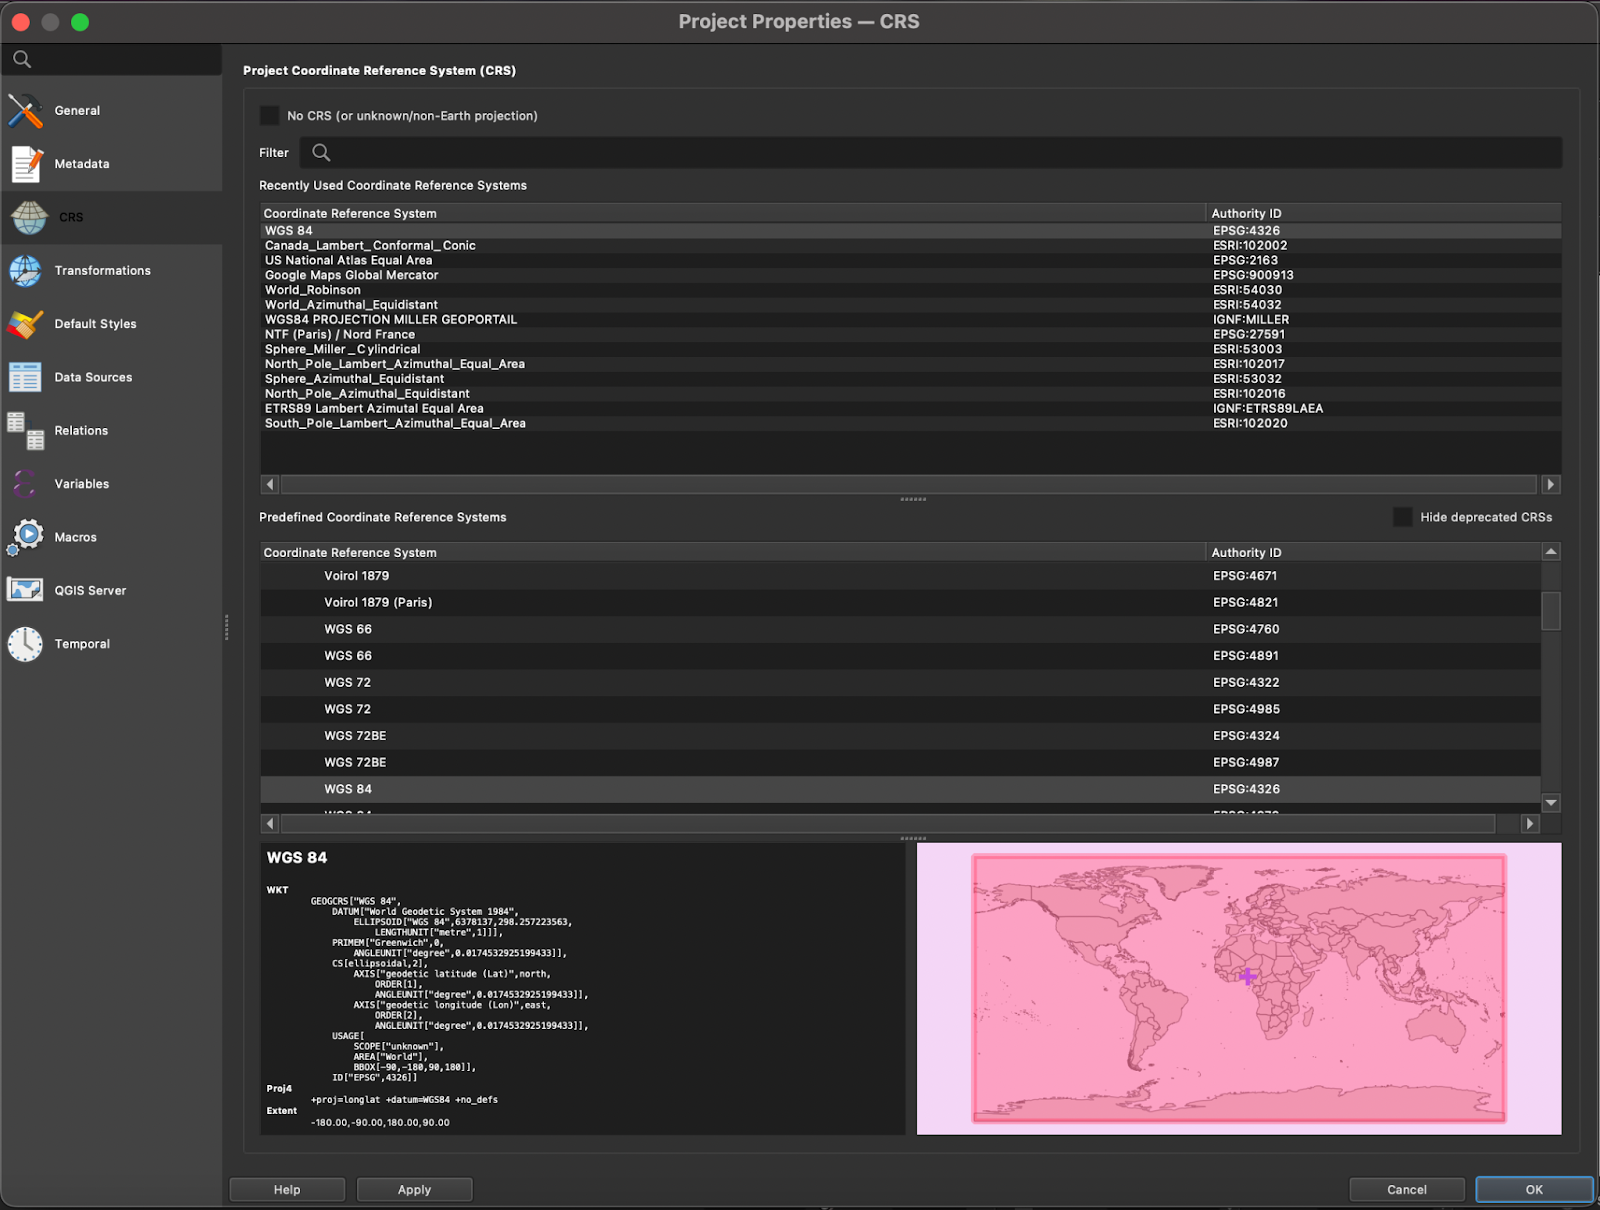
The very last thing on the Lower Bar is by far the most interesting. Upon opening a new QGIS project file, this last thing will be set to “EPSG:4326” by default. This is your map projection, and it’s a very important thing to keep in mind. EPSG:4326 is the Equirectangular projection, where all your maps will have perfect right angles and all world maps are a perfect 2:1 width to height ratio. If you wish to change your map projection, simply click on the button and it will take you to this screen:
UITXjhBD8SELbRNPfydChqEOqgo7GuhxL9JZth7HWNfIIXB79HMHEcsnYOwi-12c4jJOw2b-ya85bVuCAfDdSOJA2cfjdxPm79uE-mm9-CjGOQKfXt2s88obuZVZ_Ywq8HfFw1Vt

There’s a lot of information here, most of it irrelevant to us now, but type in “ESRI:54030,” choose the “World_Robinson” projection, and click OK.
9DuqYRPDIGig-hye2WQzCz5k6x-trEhEHrZQEUM8N18jNnBiKV9Wck_hiVLdb8NfAHubIx_i06XPVSLH6zxp5plhyu0GuGf5mPY9d6mhQwiRIFcJwhAgWfplJ1xBOiWLA8y4ALcK

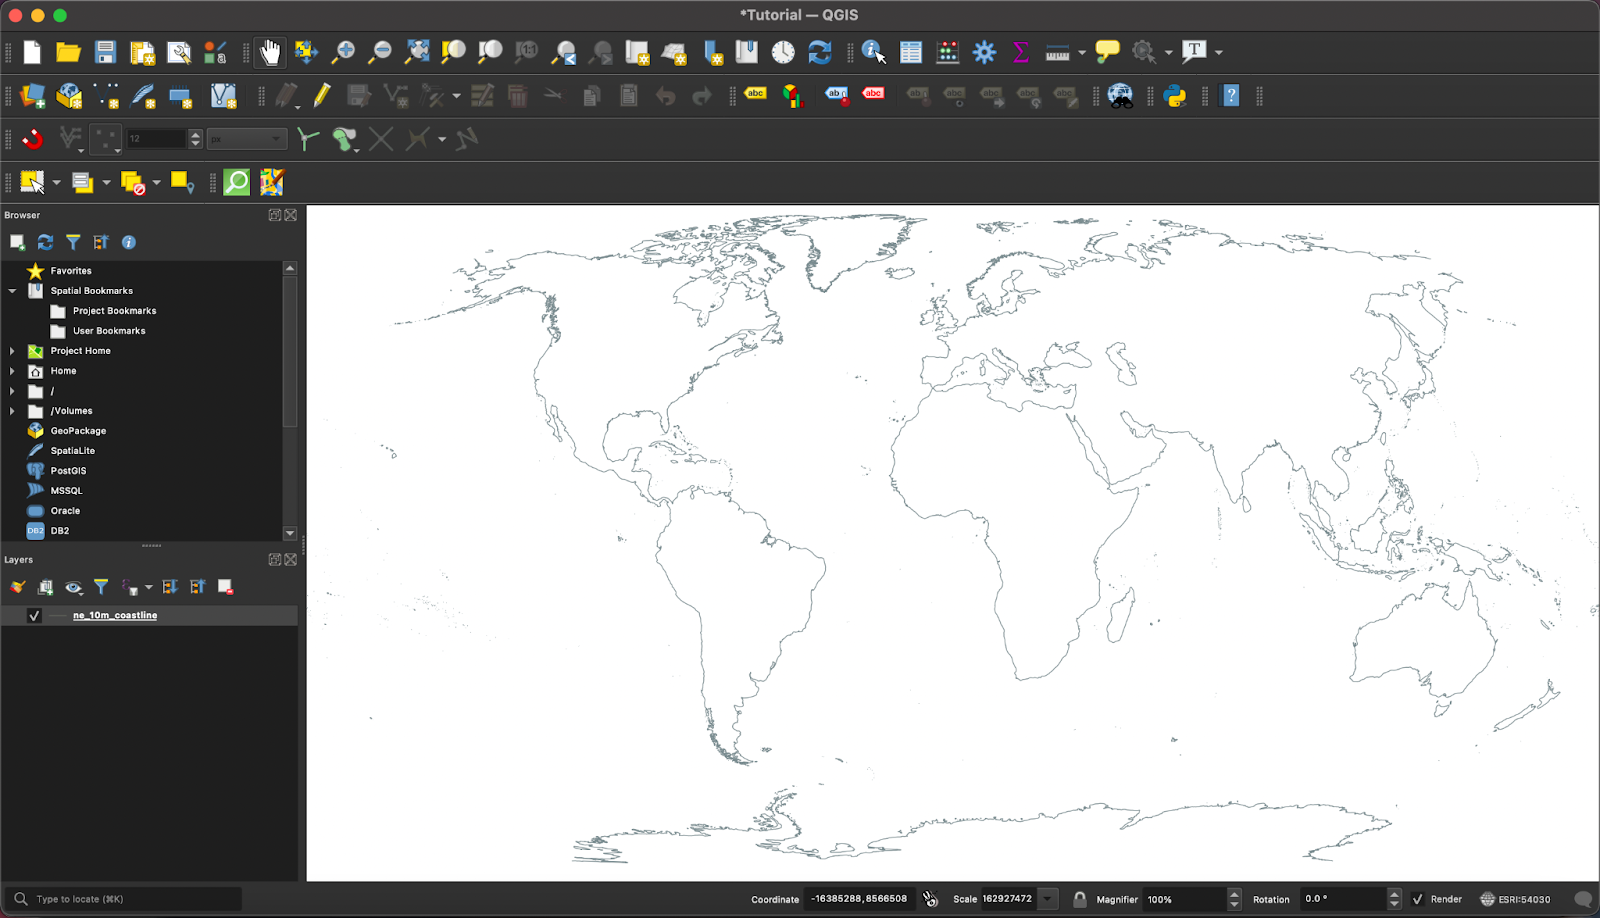
Congratulations, you’ve just “re-projected” an entire world map in the time it takes to microwave a single Hot Pocket.

2.3 - The Toolbars
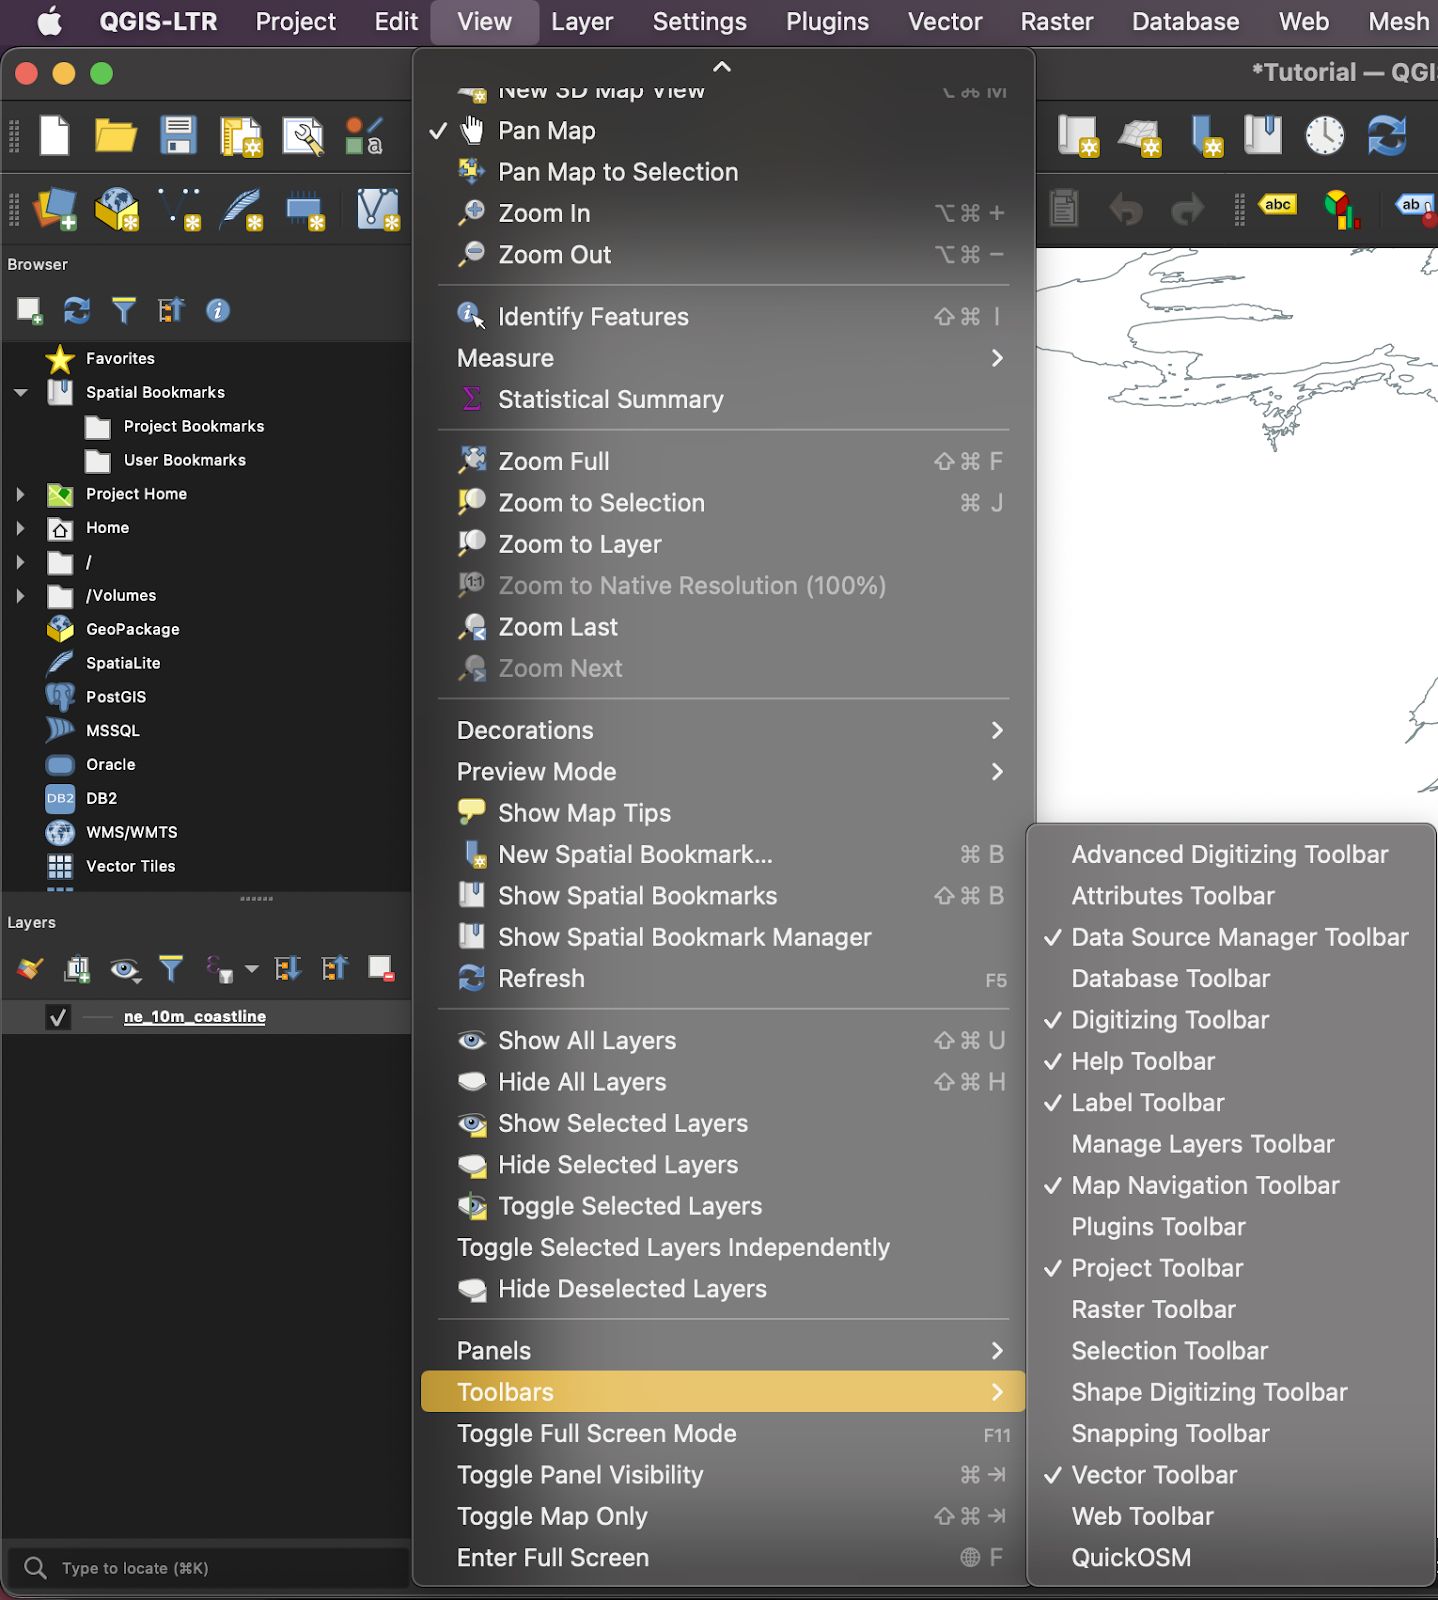
This is going to be the most complex section of this lesson, so take it as slow as you need to - I promise the knowledge you gain will be well worth it. Your first step here is to go to View -> Toolbars, and make sure you’ve got the same toolbars selected/deselected as shown in this image.
ct9TJJeAK_t97C--_jEJOgBWBtK352ac2keWALLT3FmvOj2P7DV9GfGztnq4iP2JYlx3lydRxg1Ab001eoKTSpvkQPt68mJBNHbCKeB7EjWGhCp8YeSluKrlVhH5SHLwSODX3fUh

Once you’ve finished with that, it’s time to get into the details of what exactly everything on your enabled toolbars does.
jmqoMXZ8PxZtKq7EqpuL8_YrL49A2PvkBiVUh8mIg6qNvkjm6AWrKOZcowixfUOrpK1S35RqadjF4NLhZCRLAcXuBJuP6CaO8Jhpcf72qsdzSoHMomb20HoUqe69GdLBnMXmOSlW

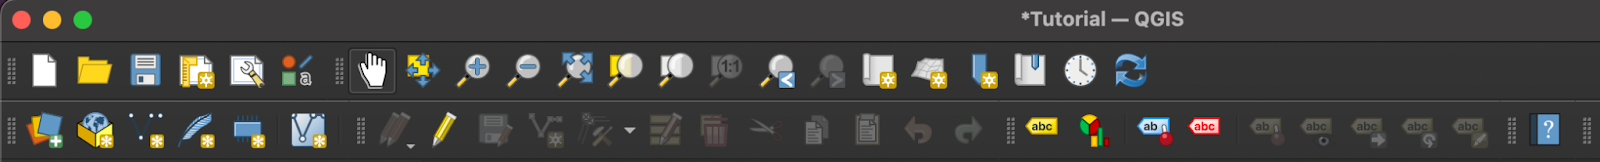
On the top toolbar, there are a few (hopefully) familiar icons. New Project, Open Project, and Save Project are represented respectively by the paper, the folder, and the floppy disk. To the right of those icons are the Print Layout, Layout Manager, and Style Manager. Those will be important to us eventually, but for now, let’s just keep moving along. The hand icon is the Pan Map option, and the four blue arrows to the right of it represent the Pan Map to Selection option.
Then comes the familiar Zoom In and Zoom Out magnifying glasses, the Zoom Full option (which shows the full map, and then the Zoom to Selection and Zoom to Layer options. Zoom to Selection zooms to anything you currently have selected, while Zoom to Layer zooms to show the full extent of your current layer. The Zoom Last and Zoom Next buttons are next, think of those as your “undo” and “redo” buttons for previous zooms you’ve done.
The following four buttons (those icons with the 6-pointed white stars and the bookmarked paper) are relatively unknown to me, they don’t contain anything very important to my knowledge, so I’ll skip them for the time being.
The last two buttons on the upper toolbar are the Temporal Controller Panel, which is helpful if you have a shapefile that shows different points in time (such as the one used to create Territorial History of the USA: Every Month for 400 Years). The final button on the upper toolbar is the simple yet mighty Refresh button. Yes, you can just use F5 too.

Many of the buttons on the lower toolbar are currently disabled because our layer is not currently in Edit Mode, and most of the currently enabled buttons are positively useless to us until we have some more practice with the other aspects of QGIS, so I’ll cover the lower taskbar (and others!) in later lessons. With that said, it’s time to move on to this lessons last section:

2.4 - The Layers
Last lesson, I only had you download and import one shapefile into QGIS, and that was for a reason - it helps immensely to keep things as simple as we can in these early days.
wwT57W3QHaapoKVfZmdDhrr6VCMhSpZcWf13mVh-yZQglToCuIJpfmIh5SIlnSJ12QWppC0bspijPekPf7PbSfDKAGM5XKD1jC3IOaY2FfzB6ZqzfRjzxEej3h1aVqRveXAweiAK
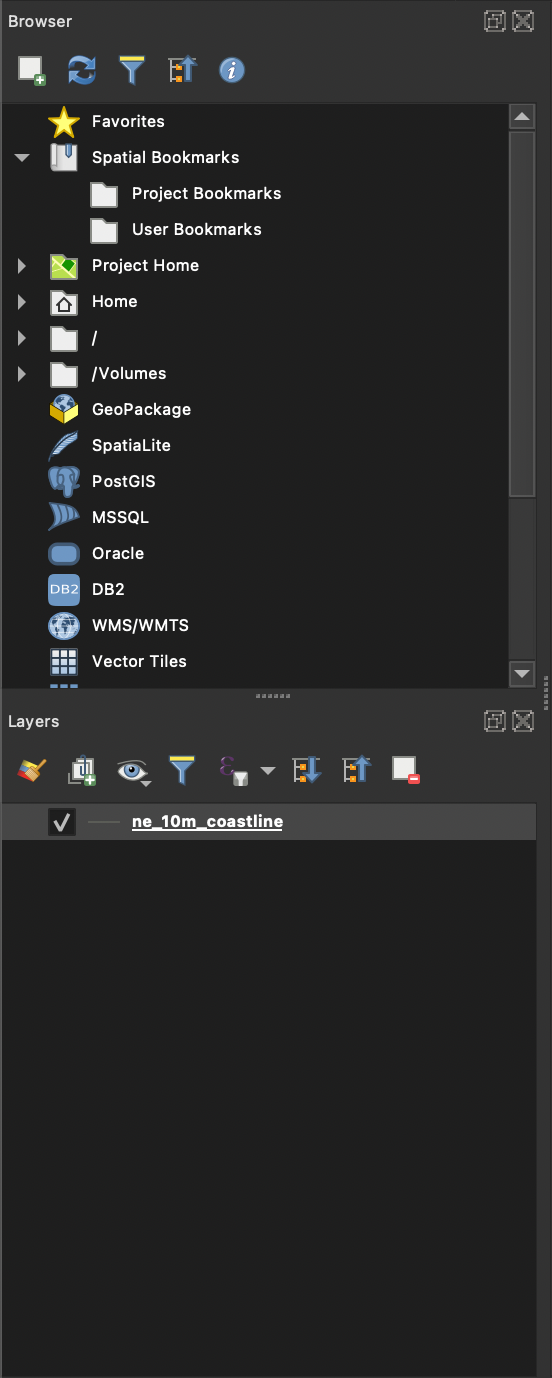
Following along with this screenshot, we can see a “Browser” section and a “Layers” section. We’ll want to ignore the Browser section for now, instead focusing on the Layers section. We’ve only imported one shapefile into this project file, so there’s only one entry in Layers - our ne_10m_coastline layer. There are several buttons immediately above our layer entry, but only the two buttons on the very edges matter. The leftmost button is the Layer Styling Panel, and it serves to open a new panel on the right side of your screen detailing all sorts of things about how your layer looks. Feel free to play around and familiarize yourself with those settings, but I won’t cover them in detail here. The rightmost button is the Remove Layer button, and it does exactly what it sounds like. Lastly, the checkbox next to your layer name shows whether or not that layer will be made visible. So, if you want your layers invisible but not deleted, use the checkbox.
That’s all I have for this lesson, so onto the homework!


Homework #2
  • Open your project file and change the projection of your map to World Robinson.
  • Use the Coordinate field and your scroll wheel to zoom onto (0.00, 0.00), then use the “Zoom to Layer” button to return to a global view.
  • Open the Layer Styling Panel and change at least one thing about the appearance of the “ne_10m_coastline” layer.
  • Use the floppy disk icon in the upper taskbar to save your project file.
 

I want to generate an over 5,000 pixels wide Equi-rectangular map of 27-30 metres below sea level, is this something I can do with QGIS and what data sources would I need for it?.​

 
Top