I wasn't sure where to post this, so if it's in the wrong spot, please move it.
I've been asked by several different people for these files and recently was told it'd be a big help to some of you if I posted them for everyone to have access to, so I'm doing just that.
I've used these graphics in my timelines in the past and while I'm not going to post every single file (which would be a massive file) I am including all the key files you'll need for a typical political timeline.
The .PSD files included are as follows. Note that most of the actual files are at a MUCH higher resolution than what's pictured here.
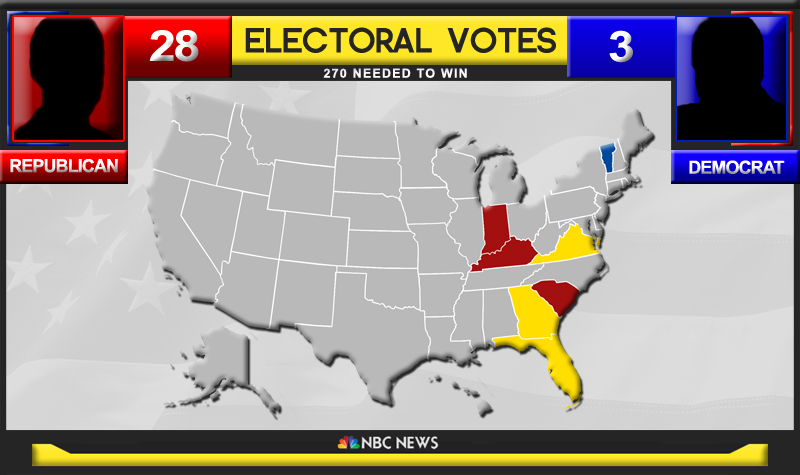
The election night map...
The base map used in the election night map. This file is larger and easier to color the states. It has to be shrunk to proper size and pasted into the election night screen for each update. Note that the white borders between states is a separate layer just above the map layer. After coloring the states each time, duplicate the border layer, hide the new layer, then merge the old with the map layer to keep the lines at a solid thickness.
The popular vote count screen. Can be adapted for caucuses, primaries, gubernatorial races, congressional, or Presidential elections.
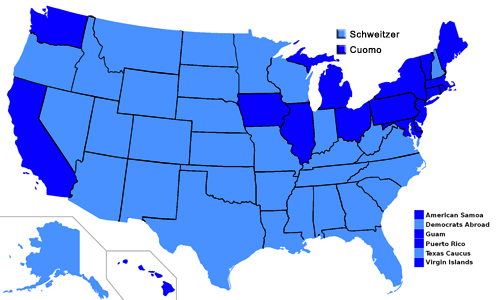
The democratic primary/caucus map. The same goes for this map regarding the borders between states (in this case they're black); see the map above for details.
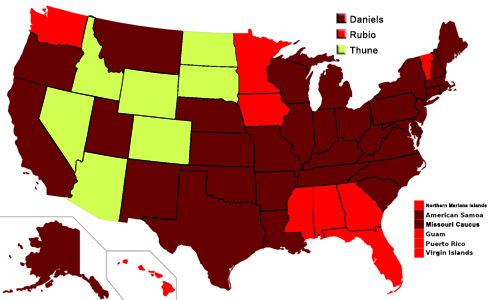
The republican version of the map. Same applies regarding the state borders layer.
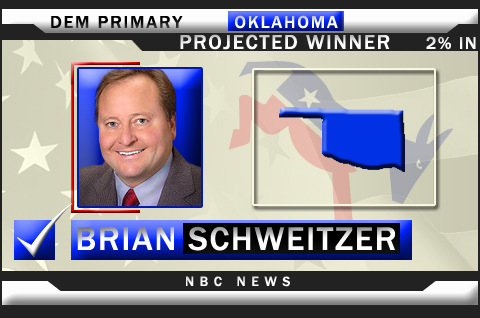
The democratic primary/caucus projection screen.
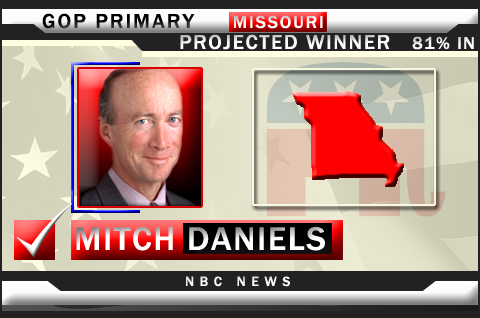
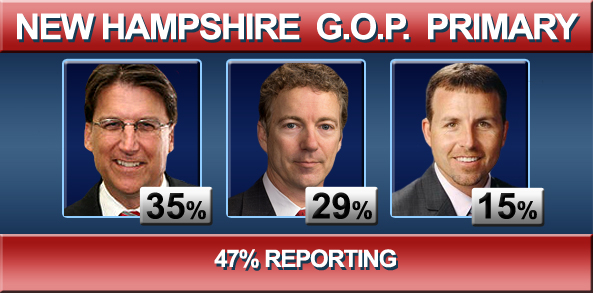
The republican primary/caucus projection screen.
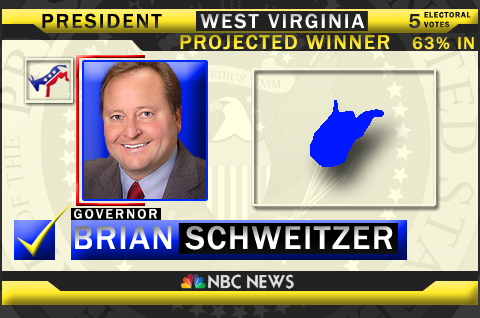
The general election projection screen for democratic wins...
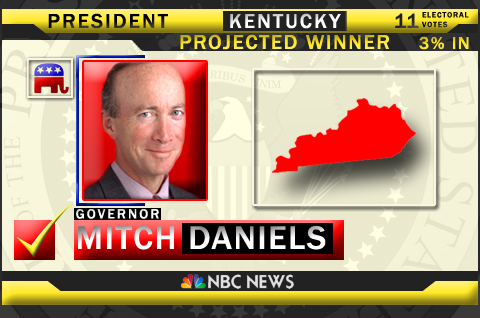
The republican general election projection screen.
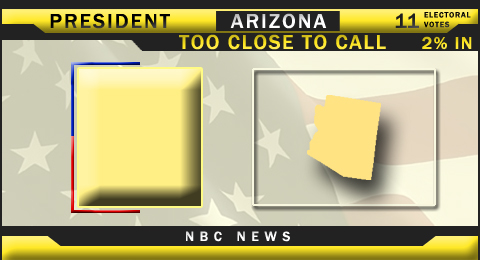
And the too close to call general election screen.
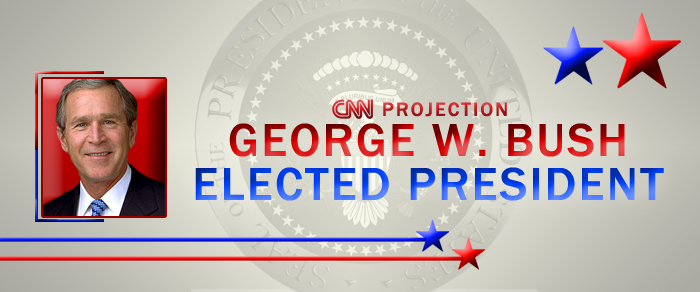
CNN Projection: ______ Elected President!
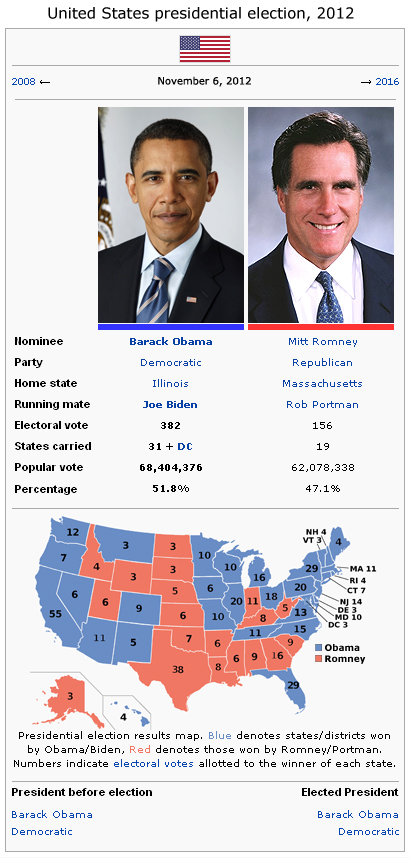
Template for standard two-way wikipedia election infobox...
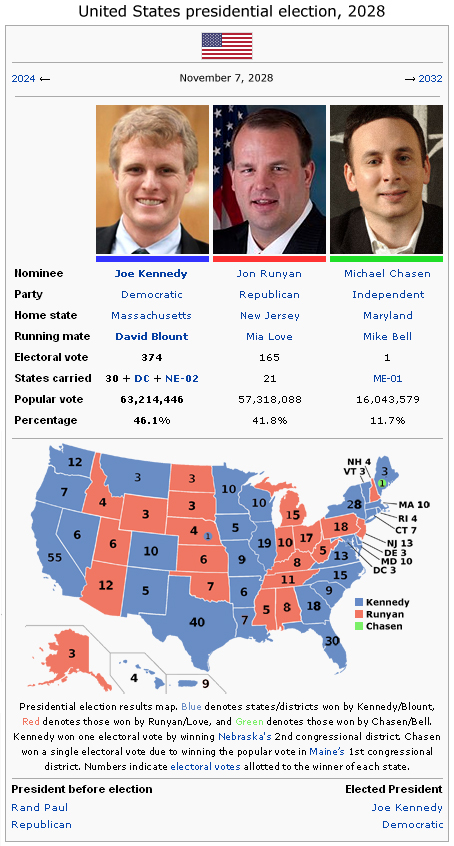
Wikipedia template for 3-way race...
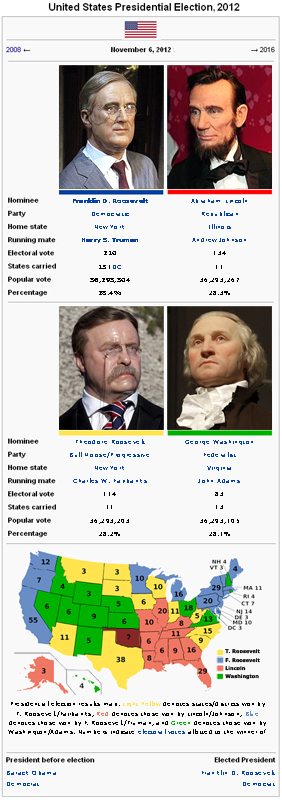
Wikipedia template for 4-way POTUS race...
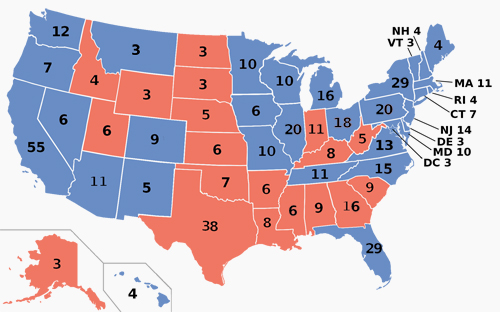
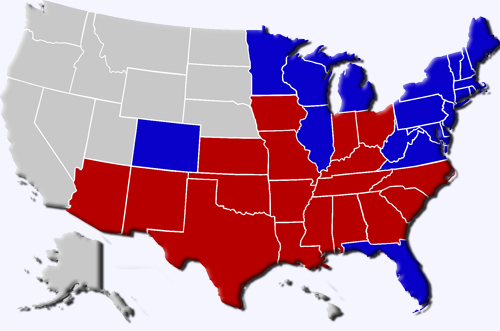
And finally, the base wikipedia electoral map based on the 2010 census with updated E.V. counts for the 2012, 2016, and 2020 elections. The same thing applies to this map in regards to the white borders between states; it's a separate layer that must be duplicated, the new layer hidden, and the old one merged with the base map layer after any coloring of the states is done. See the base election night map for details.
The file is a .zip file and is around 15 MB in size.
CLICK HERE TO DOWNLOAD THE FILE (.ZIP - 15 MB)
I've been asked by several different people for these files and recently was told it'd be a big help to some of you if I posted them for everyone to have access to, so I'm doing just that.
I've used these graphics in my timelines in the past and while I'm not going to post every single file (which would be a massive file) I am including all the key files you'll need for a typical political timeline.
The .PSD files included are as follows. Note that most of the actual files are at a MUCH higher resolution than what's pictured here.
-------------------
The election night map...
The base map used in the election night map. This file is larger and easier to color the states. It has to be shrunk to proper size and pasted into the election night screen for each update. Note that the white borders between states is a separate layer just above the map layer. After coloring the states each time, duplicate the border layer, hide the new layer, then merge the old with the map layer to keep the lines at a solid thickness.
The popular vote count screen. Can be adapted for caucuses, primaries, gubernatorial races, congressional, or Presidential elections.
The democratic primary/caucus map. The same goes for this map regarding the borders between states (in this case they're black); see the map above for details.
The republican version of the map. Same applies regarding the state borders layer.
The democratic primary/caucus projection screen.
The republican primary/caucus projection screen.
The general election projection screen for democratic wins...
The republican general election projection screen.
And the too close to call general election screen.
CNN Projection: ______ Elected President!
Template for standard two-way wikipedia election infobox...
Wikipedia template for 3-way race...
Wikipedia template for 4-way POTUS race...
And finally, the base wikipedia electoral map based on the 2010 census with updated E.V. counts for the 2012, 2016, and 2020 elections. The same thing applies to this map in regards to the white borders between states; it's a separate layer that must be duplicated, the new layer hidden, and the old one merged with the base map layer after any coloring of the states is done. See the base election night map for details.
The file is a .zip file and is around 15 MB in size.
CLICK HERE TO DOWNLOAD THE FILE (.ZIP - 15 MB)
