You are using an out of date browser. It may not display this or other websites correctly.
You should upgrade or use an alternative browser.
You should upgrade or use an alternative browser.
OTL Election maps resources thread
- Thread starter Thande
- Start date
Alex Richards
Donor
This is mainly to test the Nugaxian Election Map Scheme (NEMS) utilised in LTTW for the Empire of North America on OTL Britain. So, here's Cornwall in 1818 -the last election I can get both MPs for before Grampound was disenfranchised for corruption (seriously, the seat had been sold for 300 guineas a man. And there were only 42 voters), in all her rotten glory. With a grand total of 44 MPs, she has one fewer than the whole of Scotland, and would lose over half her seats at the Great Reform Act. Things of note:
1. The map is still very cluttered.
2. The Tories are very much in charge here.
.png")
(seriously, the seat had been sold for 300 guineas a man. And there were only 42 voters), in all her rotten glory. With a grand total of 44 MPs, she has one fewer than the whole of Scotland, and would lose over half her seats at the Great Reform Act. Things of note:1. The map is still very cluttered.
2. The Tories are very much in charge here.
Thande
Donor
Excellent piece, Alex. And Grampound was far from the worst seat in the country: there's the classic example of Old Sarum, which had no voters at all yet elected two MPs (including at least one Prime Minister!) for centuries.
The real problem with elections in this period was how malleable and ambiguous party identity was. Someone might be called a non-partisan in one source and a Whig or Tory in another. You're almost better off calling them Government and Opposition or something like that.
The real problem with elections in this period was how malleable and ambiguous party identity was. Someone might be called a non-partisan in one source and a Whig or Tory in another. You're almost better off calling them Government and Opposition or something like that.
Alex Richards
Donor
Excellent piece, Alex. And Grampound was far from the worst seat in the country: there's the classic example of Old Sarum, which had no voters at all yet elected two MPs (including at least one Prime Minister!) for centuries.
The real problem with elections in this period was how malleable and ambiguous party identity was. Someone might be called a non-partisan in one source and a Whig or Tory in another. You're almost better off calling them Government and Opposition or something like that.
Except then they move in and out of government by how well their relationship with Lord X or Bishop Y is going at any particular point, never quite going to the opposition, but often out of government.
Thande
Donor
Yeah, it's just annoying. Although the 1810s arguably aren't as bad as the 1840s which I've been reading about lately, the realigning of the parties is such that you can't keep track of who's in government.Except then they move in and out of government by how well their relationship with Lord X or Bishop Y is going at any particular point, never quite going to the opposition, but often out of government.

Thande
Donor
And to follow up with a more normal example, here's Devon, same year.
I wonder where the Whig county strongholds were in that year?
Also, how do you plan to show the university constituencies?
Alex Richards
Donor
I wonder where the Whig county strongholds were in that year?
Also, how do you plan to show the university constituencies?
University constituencies would, I think, be best as a seperate borough-style layout without line on the Oxfordshire/Cambridgeshire maps. A square box could probably be used for the County Corporates. EDIT: Which Exeter actually should be.
As for the Whigs, the problem is we're right in the middle of the long period of Tory dominance between 1783 and 1830. I think it would be a case of coming across them by accident, so to speak, though, as its virtually impossible to work out from national results, county constituency results etc.
Thande
Donor
It was a period of Tory dominance but the 1818 election still saw a pretty strong Whig opposition, I'm just wondering if the Whigs are thinly distributed or there are some areas that are Whig strongholds despite the overall Tory dominance.University constituencies would, I think, be best as a seperate borough-style layout without line on the Oxfordshire/Cambridgeshire maps. A square box could probably be used for the County Corporates. EDIT: Which Exeter actually should be.
As for the Whigs, the problem is we're right in the middle of the long period of Tory dominance between 1783 and 1830. I think it would be a case of coming across them by accident, so to speak, though, as its virtually impossible to work out from national results, county constituency results etc.
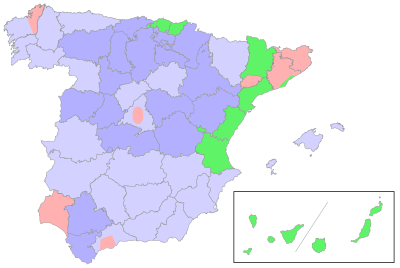
I doubt there will ever be a post-1977 Spain TL but here goes the OTL results:
1977 GE: Green - Centre, Red - Socialist, Orange - Catalan nationalist right, Dark Green - Basque nationalist right
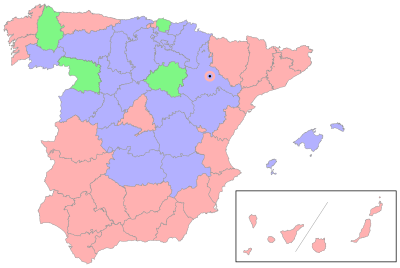
1979 GE: Blue - Centre, Red - Socialist, Green - Basque nationalist right
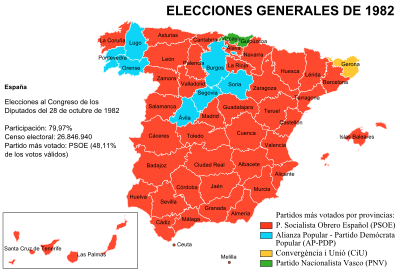
1982 GE, after the UCD's great blunder:
Red - Socialist, Blue - Right, Green - Basque nationalist right, Orange - Catalan nationalist right
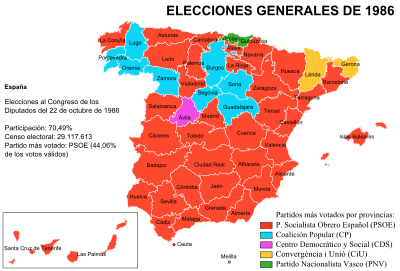
1986 GE: Red - Socialist, Blue - Right, Green - Basque nationalist right, Orange - Catalan nationalist right, Pink - Centre
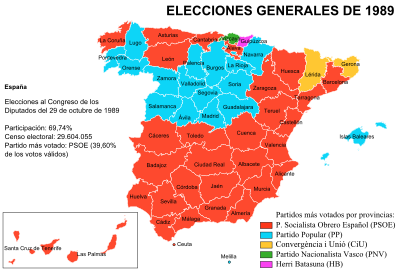
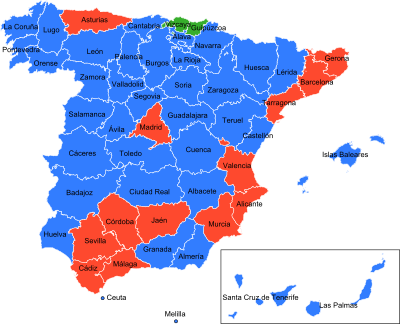
1989 GE: Red - Socialist, Blue - Right, Orange - Catalan nationalist right, Green - Basque nationalist right, Pink - Basque nationalist left
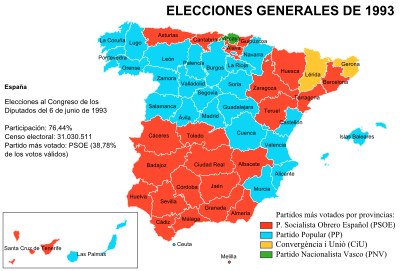
1993 GE: Red - Socialist, Blue - Right, Orange - Catalan nationalist right, Green - Basque nationalist right
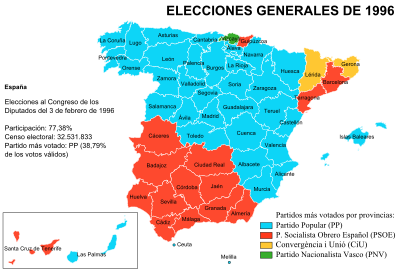
1996 GE: Blue - Right, Red - Socialist, Orange - Catalan nationalist right, Green - Basque nationalist right
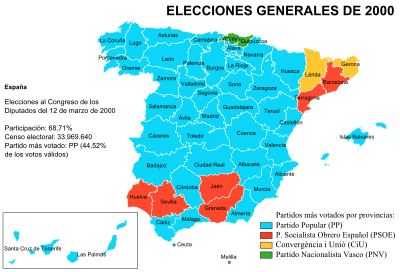
2000 GE: Blue - Right, Red - Socialist, Orange - Catalan nationalist right, Green - Basque nationalist right
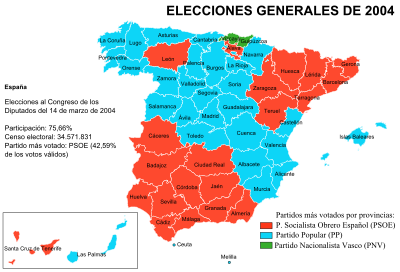
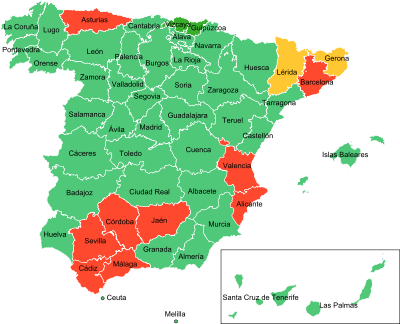
2004 GE: Red - Socialist, Blue - Right, Green - Basque nationalist right

2008 GE: Red - Socialist, Blue - Right
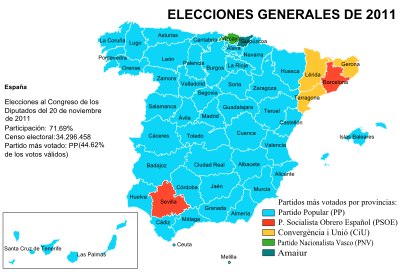
2011 GE: Blue - Right, Red - Socialist, Orange - Catalan nationalist right, Green - Basque nationalist right, Dark Green - Basque nationalist left
1977 GE: Green - Centre, Red - Socialist, Orange - Catalan nationalist right, Dark Green - Basque nationalist right
1979 GE: Blue - Centre, Red - Socialist, Green - Basque nationalist right
1982 GE, after the UCD's great blunder:
Red - Socialist, Blue - Right, Green - Basque nationalist right, Orange - Catalan nationalist right
1986 GE: Red - Socialist, Blue - Right, Green - Basque nationalist right, Orange - Catalan nationalist right, Pink - Centre
1989 GE: Red - Socialist, Blue - Right, Orange - Catalan nationalist right, Green - Basque nationalist right, Pink - Basque nationalist left
1993 GE: Red - Socialist, Blue - Right, Orange - Catalan nationalist right, Green - Basque nationalist right
1996 GE: Blue - Right, Red - Socialist, Orange - Catalan nationalist right, Green - Basque nationalist right
2000 GE: Blue - Right, Red - Socialist, Orange - Catalan nationalist right, Green - Basque nationalist right
2004 GE: Red - Socialist, Blue - Right, Green - Basque nationalist right
2008 GE: Red - Socialist, Blue - Right
2011 GE: Blue - Right, Red - Socialist, Orange - Catalan nationalist right, Green - Basque nationalist right, Dark Green - Basque nationalist left
Thande
Donor
Some maps of the popular vote distribution in the unusual four-candidate US presidential election of 1912 I made.
I could perhaps have chosen a better scale, especially for Wilson (there's no distinction here between northern states where he got 41% and southern states where--in the case of South Carolina--he got 95%!) but hey.

I could perhaps have chosen a better scale, especially for Wilson (there's no distinction here between northern states where he got 41% and southern states where--in the case of South Carolina--he got 95%!) but hey.
Thande
Donor
I did France as well, for the two elections since they adopted sub-national constituencies in 2004. Not posting the popular vote because it's boring--in 2009 the UMP came top in every region, and in 2004 the Socialists came top in every region except Outremer where the Communists did.

Thande
Donor
Map of the party members' popular vote by constituency in the 2010 Labour leadership election. Note that because the Labour Party uses an electoral college system, this only represents one-third of the process, the rest being made up of polling MPs and affiliated organisations such as trade unions. Hence Ed Miliband was the eventual victor even though David Miliband swept the party members, as seen here.
Derived from a map on the Genocide which was badly recoloured.

Derived from a map on the Genocide which was badly recoloured.
Alex Richards
Donor
Really strikes home just how much of an issue there is with Ed's leadership in relation to how much support he has in the party. I think I can count the number of big, labour voting cities he actually won, and still have fingers to spare.
Thande
Donor
Yeah, I was struck by just how many of the constituencies Ed won were in rural areas that would never vote Labour.Really strikes home just how much of an issue there is with Ed's leadership in relation to how much support he has in the party. I think I can count the number of big, labour voting cities he actually won, and still have fingers to spare.
Never mind. Can't figure out how to properly size it to something like Thande's.
Can't you just show the small blank map from US Election Atlas? Or is this by county or something?
1988 Democratic Primary County Map

Can't you just show the small blank map from US Election Atlas? Or is this by county or something?
Slightly bigger, but still too small to work out some of the details.
Share: