Have you heard of "carpetbagging"?Wait a minute...!
You are using an out of date browser. It may not display this or other websites correctly.
You should upgrade or use an alternative browser.
You should upgrade or use an alternative browser.
Alternate Electoral Maps
- Thread starter Tayya
- Start date
- Status
- Not open for further replies.
Please, can we hurry up and get a full world basemap of this?Insane USWank Electoral Map
Please, can we hurry up and get a full world basemap of this?
I've thought about this, but still could not get a solid base for the future do everything. And all at once is almost impossible because I do manual work, taking a base map and other skirting through Photoshop, and trim the edges. But I promise that within a few days our beloved Poland, the Caucasus, North Korea and Iran will be appear on this map.
1824 Presidential Election

Zebulon M. Pike (C-LA)/James Monroe (C-VA) 152 EV
Aaron Burr ('BC'-New York)/various candidates 55 EV
Daniel Webster (F-NH)/John C. Calhoun (F-SC) 11 EV
John L. Manning (S-SC) 11 EV
The Confederationist's reach a massive victory. So massive that the second most electoral votes was awarded to a Confederationist splinter group led by Burr. Yet, it is now understood that Burr and the machinations of the Southern Party hurt the Federalist's more than they did the Confederationist's, leaving Pike with a landslide.
The base map for an alternate USA, the one that I'm talking about here and developed more elsewhere. The box columns denote extraterrestial states, mostly on the Moon. The box without any land is an aquatic state (for aquatic bases and merfolk mostly).

Why is Connecticut split but the Carolinas united? Saybrook and New Haven colonies had been absorbed by Connecticut a long time before the Revolution, and the Carolinas had likewise been split long before, too.The base map for an alternate USA, the one that I'm talking about here and developed more elsewhere. The box columns denote extraterrestial states, mostly on the Moon. The box without any land is an aquatic state (for aquatic bases and merfolk mostly).
Lots and lots of butterflies. Not a realistic ATL as can be shown by the ponies, merfolk and whatnot.Why is Connecticut split but the Carolinas united? Saybrook and New Haven colonies had been absorbed by Connecticut a long time before the Revolution, and the Carolinas had likewise been split long before, too.
A map of a possible 2016 election based on current polling between the Democratic & Republican front-runners according to polling on the Genocide. I picked the VP nominees at random, before anyone asks.
Here's the methodology I used:
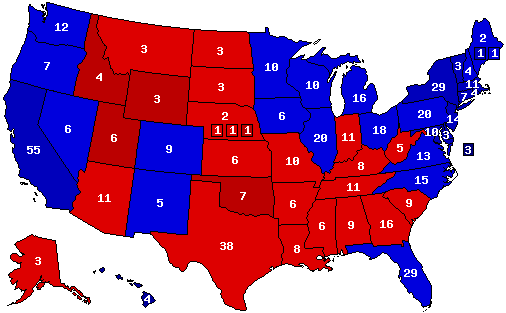
Hillary Clinton/Martin O'Malley (Democratic): 347 EV, 53.6% PV
Jeb Bush/Mike Huckabee (Republican): 191 EV, 44.6% PV
Surprisingly, the only state that changes from 2012 is North Carolina, but Clinton comes close to flipping Georgia, Indiana, and Missouri as well.
Here's the methodology I used:
- I found an Obama/Romney poll that corresponded closely to the similar point in the previous presidential election cycle as the most recent one between Hillary & Jeb.
- I then factored in the difference between the polls' projected result and the OTL result and made it a factor into calculating their raw percentages.
- State-by-state results:
- Clinton gained a bonus to make up for the votes lost in 2012 because Obama is black, as per the Harvard study linked on a scale from 5% (WV) to 1.5% (UT).
- Took 5% off the base percentages in Illinois and Massachusetts for Clinton and Bush respectively, as they do not share the 2012 candidates' home states. Subtracted 2.5% from Clinton in Hawaii and Bush in Utah to compensate for Clinton not being a Hawaii native and Bush not being Mormon.
- Gave Clinton 5% in New York & Bush 5% in Florida as a home state bonus. Gave Clinton a "half-home state" bonus of 2.5% in Arkansas.
- Used Nate Silver's Elastic State model when applying the national swing.
- Clinton gained a bonus to make up for the votes lost in 2012 because Obama is black, as per the Harvard study linked on a scale from 5% (WV) to 1.5% (UT).
Hillary Clinton/Martin O'Malley (Democratic): 347 EV, 53.6% PV
Jeb Bush/Mike Huckabee (Republican): 191 EV, 44.6% PV
Surprisingly, the only state that changes from 2012 is North Carolina, but Clinton comes close to flipping Georgia, Indiana, and Missouri as well.
1912 if Roosevelt had won all the states where he came 2nd in addition to the states he won IOTL:
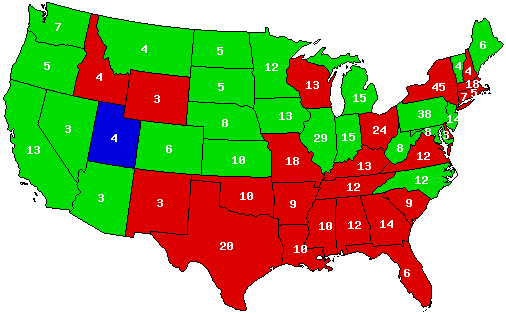
284 Wilson-243 Roosevelt-4 Taft
284 Wilson-243 Roosevelt-4 Taft
Last edited:
So I was curious to see who would win in the landslide elections, so I pit Lyndon B. Johnson from 1964 against Richard Nixon from 1972 against each other. No numbers were adjusted, since these elections are only eight years apart.
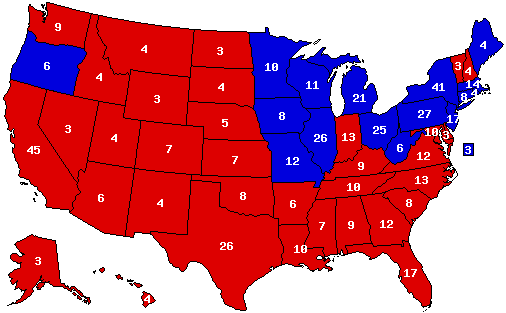
Republican: Richard Nixon (California)/Spiro Agnew (Maryland) - 295 EVs, 52.2%
Democratic: Lyndon B. Johnson (Texas)/Hubert Humphrey (Minnesota) - 243 EVs, 47.8%
Republican: Richard Nixon (California)/Spiro Agnew (Maryland) - 295 EVs, 52.2%
Democratic: Lyndon B. Johnson (Texas)/Hubert Humphrey (Minnesota) - 243 EVs, 47.8%
Will Kürlich Kerl
Banned
Can someone create an electoral map of the 1910 UK general elections with the Liberal and Conservative parties taken out of the picture?
And for the Americans on the board, how about a Thurmond (R) vs. Wallace (D) race in 1972?
And for the Americans on the board, how about a Thurmond (R) vs. Wallace (D) race in 1972?
I was thinking of doing a Thurmond vs. Wallace, but I'm not even sure how that would go down.Can someone create an electoral map of the 1910 UK general elections with the Liberal and Conservative parties taken out of the picture?
And for the Americans on the board, how about a Thurmond (R) vs. Wallace (D) race in 1972?
Can someone create an electoral map of the 1910 UK general elections with the Liberal and Conservative parties taken out of the picture?
What do you mean by an electoral map? Do you mean all 670 constituencies with the winner without Libs & Cons - that's very difficult, as most seats were uncontested by third parties. Or a county by county map with the third parties? Or a hypothetical - EDIT: i.e. like this?
Last edited:
So this is what happens when you flip the 1972 percentages with the 1968 percentages.
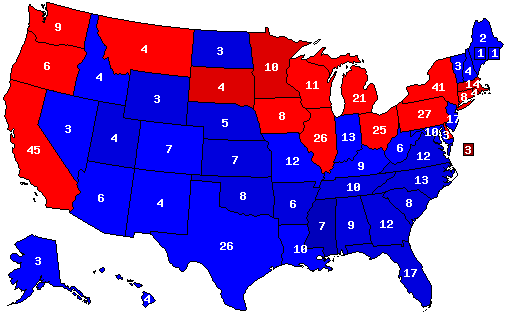
President Richard Nixon/Vice President Spirio Agnew (Republican) - 269 Electoral Votes, 43.4% PV
Senator George McGovern/Senator Thomas Eagleton (Democratic) - 269 Electoral Votes, 42.7% PV
Congressman John Schmitz/Author Thomas Anderson (American Independent) - 13.5% PV
President Richard Nixon/Vice President Spirio Agnew (Republican) - 269 Electoral Votes, 43.4% PV
Senator George McGovern/Senator Thomas Eagleton (Democratic) - 269 Electoral Votes, 42.7% PV
Congressman John Schmitz/Author Thomas Anderson (American Independent) - 13.5% PV
And vice versa...
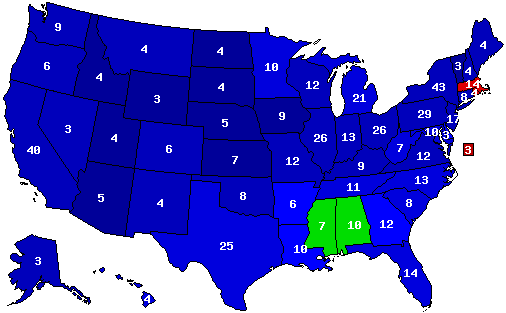
Former Vice President Richard Nixon/Governor Spirio Agnew (Republican) - 500 Electoral Votes, 60.7% PV
Vice President Hubert Humphrey/Senator Edmund Muskie (Democratic) - 21 Electoral Votes, 37.5% PV
Former Governor George Wallace/General Curtis LeMay (American Independent) - 17 Electoral Votes, 1.4% PV
And its counterpart:So I was curious to see who would win in the landslide elections, so I pit Lyndon B. Johnson from 1964 against Richard Nixon from 1972 against each other. No numbers were adjusted, since these elections are only eight years apart.
Republican: Richard Nixon (California)/Spiro Agnew (Maryland) - 295 EVs, 52.2%
Democratic: Lyndon B. Johnson (Texas)/Hubert Humphrey (Minnesota) - 243 EVs, 47.8%
Democratic: George McGovern (South Dakota)/Sargent Shriver (Maryland) - 372 EVs, 51.8%
Republican: Barry Goldwater (Arizona)/William E. Miller (New York) - 166 EVs, 48.2%
So I took the seven elections between 1988 and 2012, and put them all on a map, with each state shaded by the number of times each party won there- darkest is 7/7, dark 6/7, medium 5/7, light 4/7, you get the idea.
The results were interesting, albeit rather predictable; with the Democrats winning 4.5/7 of these elections, it makes sense they'd win the cumulative, but it is worth noting that the swing state narrative, while still viable, does look a little different going just by the winners.
(Possible ideas for future variations: maps that shade by margin of victory or adjusted margin of victory.)

A map of a possible 2016 election based on current polling between the Democratic & Republican front-runners according to polling on the Genocide. I picked the VP nominees at random, before anyone asks.
Here's the methodology I used:
- I found an Obama/Romney poll that corresponded closely to the similar point in the previous presidential election cycle as the most recent one between Hillary & Jeb.
- I then factored in the difference between the polls' projected result and the OTL result and made it a factor into calculating their raw percentages.
- State-by-state results:
- Clinton gained a bonus to make up for the votes lost in 2012 because Obama is black, as per the Harvard study linked on a scale from 5% (WV) to 1.5% (UT).
- Took 5% off the base percentages in Illinois and Massachusetts for Clinton and Bush respectively, as they do not share the 2012 candidates' home states. Subtracted 2.5% from Clinton in Hawaii and Bush in Utah to compensate for Clinton not being a Hawaii native and Bush not being Mormon.
- Gave Clinton 5% in New York & Bush 5% in Florida as a home state bonus. Gave Clinton a "half-home state" bonus of 2.5% in Arkansas.
- Used Nate Silver's Elastic State model when applying the national swing.
Hillary Clinton/Martin O'Malley (Democratic): 347 EV, 53.6% PV
Jeb Bush/Mike Huckabee (Republican): 191 EV, 44.6% PV
Surprisingly, the only state that changes from 2012 is North Carolina, but Clinton comes close to flipping Georgia, Indiana, and Missouri as well.
This is a pretty solid prediction. Have you posted it in the 2016 thread?
The base map for an alternate USA, the one that I'm talking about here and developed more elsewhere. The box columns denote extraterrestial states, mostly on the Moon. The box without any land is an aquatic state (for aquatic bases and merfolk mostly).
Very nice map, but some of the islands still aren't connected.
- Status
- Not open for further replies.
Share: