Alternate Electoral Maps III

<SNIP> Here's a fun riddle; describe how this county map happens in any Presidential election between 1980 and 2008. bonus points if you can guess the exact state map too.
I'm pretty sure each state is swung from its 1988 result in some way, but this can't quite be one where the Democratic-Republican margin is reversed in each state, at least not from 1988. Could it be one where the margin is reversed from 2004?
 
I'm pretty sure each state is swung from its 1988 result in some way, but this can't quite be one where the Democratic-Republican margin is reversed in each state, at least not from 1988. Could it be one where the margin is reversed from 2004?
No, it's not an inverse map.
 
1964 Election:
John F. Kennedy/Terry Sanford (Democratic) 474 Electoral Votes; 62.5%
Barry Goldwater/John Tower (Republican) 64 Electoral Votes; 37.0%

I'm a bit late but I wanted to say this updated map is much more plausible - although I'd probably swap Virginia and Idaho. there's a lot of interesting questions/guess work involved here though, I could see an argument that Kennedy would have done better than LBJ in Idaho considering he did do far better there relative to the NPV in 1960 than LBJ did in 1964. Also, Louisiana could potentially be interesting because of Kennedy's Catholicism which allowed him to win it in a blowout in '60 - it would certainly at the very least be closer than it was in OTL 1964 and I think there's a chance Kennedy could have won it outright - with regards to the South I also think Kennedy would have been better than Johnson at selling civil rights to the region's white voters and he also probably would have kept more ancestral Dems that switched to Goldwater in OTL.
 
Here's a flashback to the first Alternate Election map thread. The ultimate base map of the United States and i'll be doing every presidential election 1992. However unlike the original i'll slightly change the party system from 3 1/2 parties (Conservative,Liberal,Labor,Nationalist), I'm going to have it 2 1/2 (Conservative,Liberal Democrat and Labor). However smaller parties like the Reform party,Green party,Libertarian and even the Nationalists are smaller parties that do win seats in the House of Representatives & even the Senate. Any ways on with the show.

Ulimate Election 1992.png
1992: The Third Way is the best way
Liberal Democrat: Governor Bill Clinton (AR)/Governor Wim Kok (NL): 43% Popular vote
Conservative: President George H.W Bush (TX)/Vice President John Howard (NW): 26.7% Popular vote
Reform: CEO Ross Perot (TX)/Admiral Sandy Woodard (EG): 18.9% Popular vote
Labor: Governor Felipe González (EP)/Senator Jean Chrétien (QB) 11.4% Popular vote


Ulimate election 1996.png

1996: The Conservative Revolution rebutted.
Liberal Democrat: President Bill Clinton (AR)/Vice President Wim Kok (NL): 46.2% Popular vote
Conservative: Governor Jim Bolger (NZ)/Representative Jack Kemp (NY): 29.7% Popular vote
Labor: Governor Nelson Mandela (SA)/Governor Gro Harlem Brundtland (NO) 15.2%
Reform: Party founder Ross Perot (TX)/
Economist Dominique Strauss-Kahn (FR): 8.9% Popular vote

Ulimate election 2000.png
2000: The divided vote
Conservative: Governor George W Bush (TX)/General Michel Roquejeoffre (FR): 41.7% Popular vote
Liberal Democrat: Vice President Wim Kok/Senator Al Gore (TN): 41.3% Popular vote
Labor: Governor Chen Shui-bian (TW)/Governor Jack McConnell (ST): 11.9%
Green: Representative Gerry Adams (IE)/Activist Ralph Nader (CT): 5.1% Popular Vote


Last edited:
This is a bit of an out-there idea I've been working on, and it's kind of similar to my American Federation one.

upload_2019-10-14_2-41-18.png


The United Kingdoms of Britain and Ireland, colloquially known as the UK or Britain, is a grouping of nineteen nations, ten of which are found on the island of Great Britain, eight of which are on the island of Ireland and one, Brittany, is part of continental Europe geographically. During the reign of Æthelstan in the 11th century, the 'heptarchy' as it was then known, comprising the kingdoms of East Anglia, Essex, Kent, Mercia, Northumbria, Sussex and Wessex, was almost dissolved by the then-king; however, he relented and allowed these kingdoms to continue in existence as part of the so-called Union of England. Ironically, of course, this union was rather disunited, which helped contribute to England's defeat by the Normans in 1066.

After the end of the Norman period, during which the cities of London and Westminster became the political centre of the Union, the kingdom of Brittany was admitted to the Union; in 1542, Wales was integrated, in 1707, it united with Scotland to become the United Kingdoms of Great Britain, and in 1801 it united with the eight kingdoms of Ireland to become the United Kingdoms of Great Britain and Ireland. With the Great Reform Act in 1832, the so-called 'rotten boroughs' that had existed across the country were disestablished and Parliamentary reform saw the constituencies dramatically changed to account for shifts in population, along with an expansion of the franchise; further reforms giving the vote to more people were carried out in 1867, 1884 and finally in 1918, when all men over 21 and women over 30 were granted the right to vote across the UK.

Something else that flared up during the mid-19th century was pressure on the government at Westminster to permit devolution (or 'home rule' as it was popularly known) to the British and Irish nations. In order to appease voters opposed to Home Rule in Ireland, the government of William Gladstone pushed for, and eventually established, home rule for every constituent nation of Britain, which took a similar form to the state and provincial legislatures of the US and Canada as well as devolving powers to these legislative bodies.

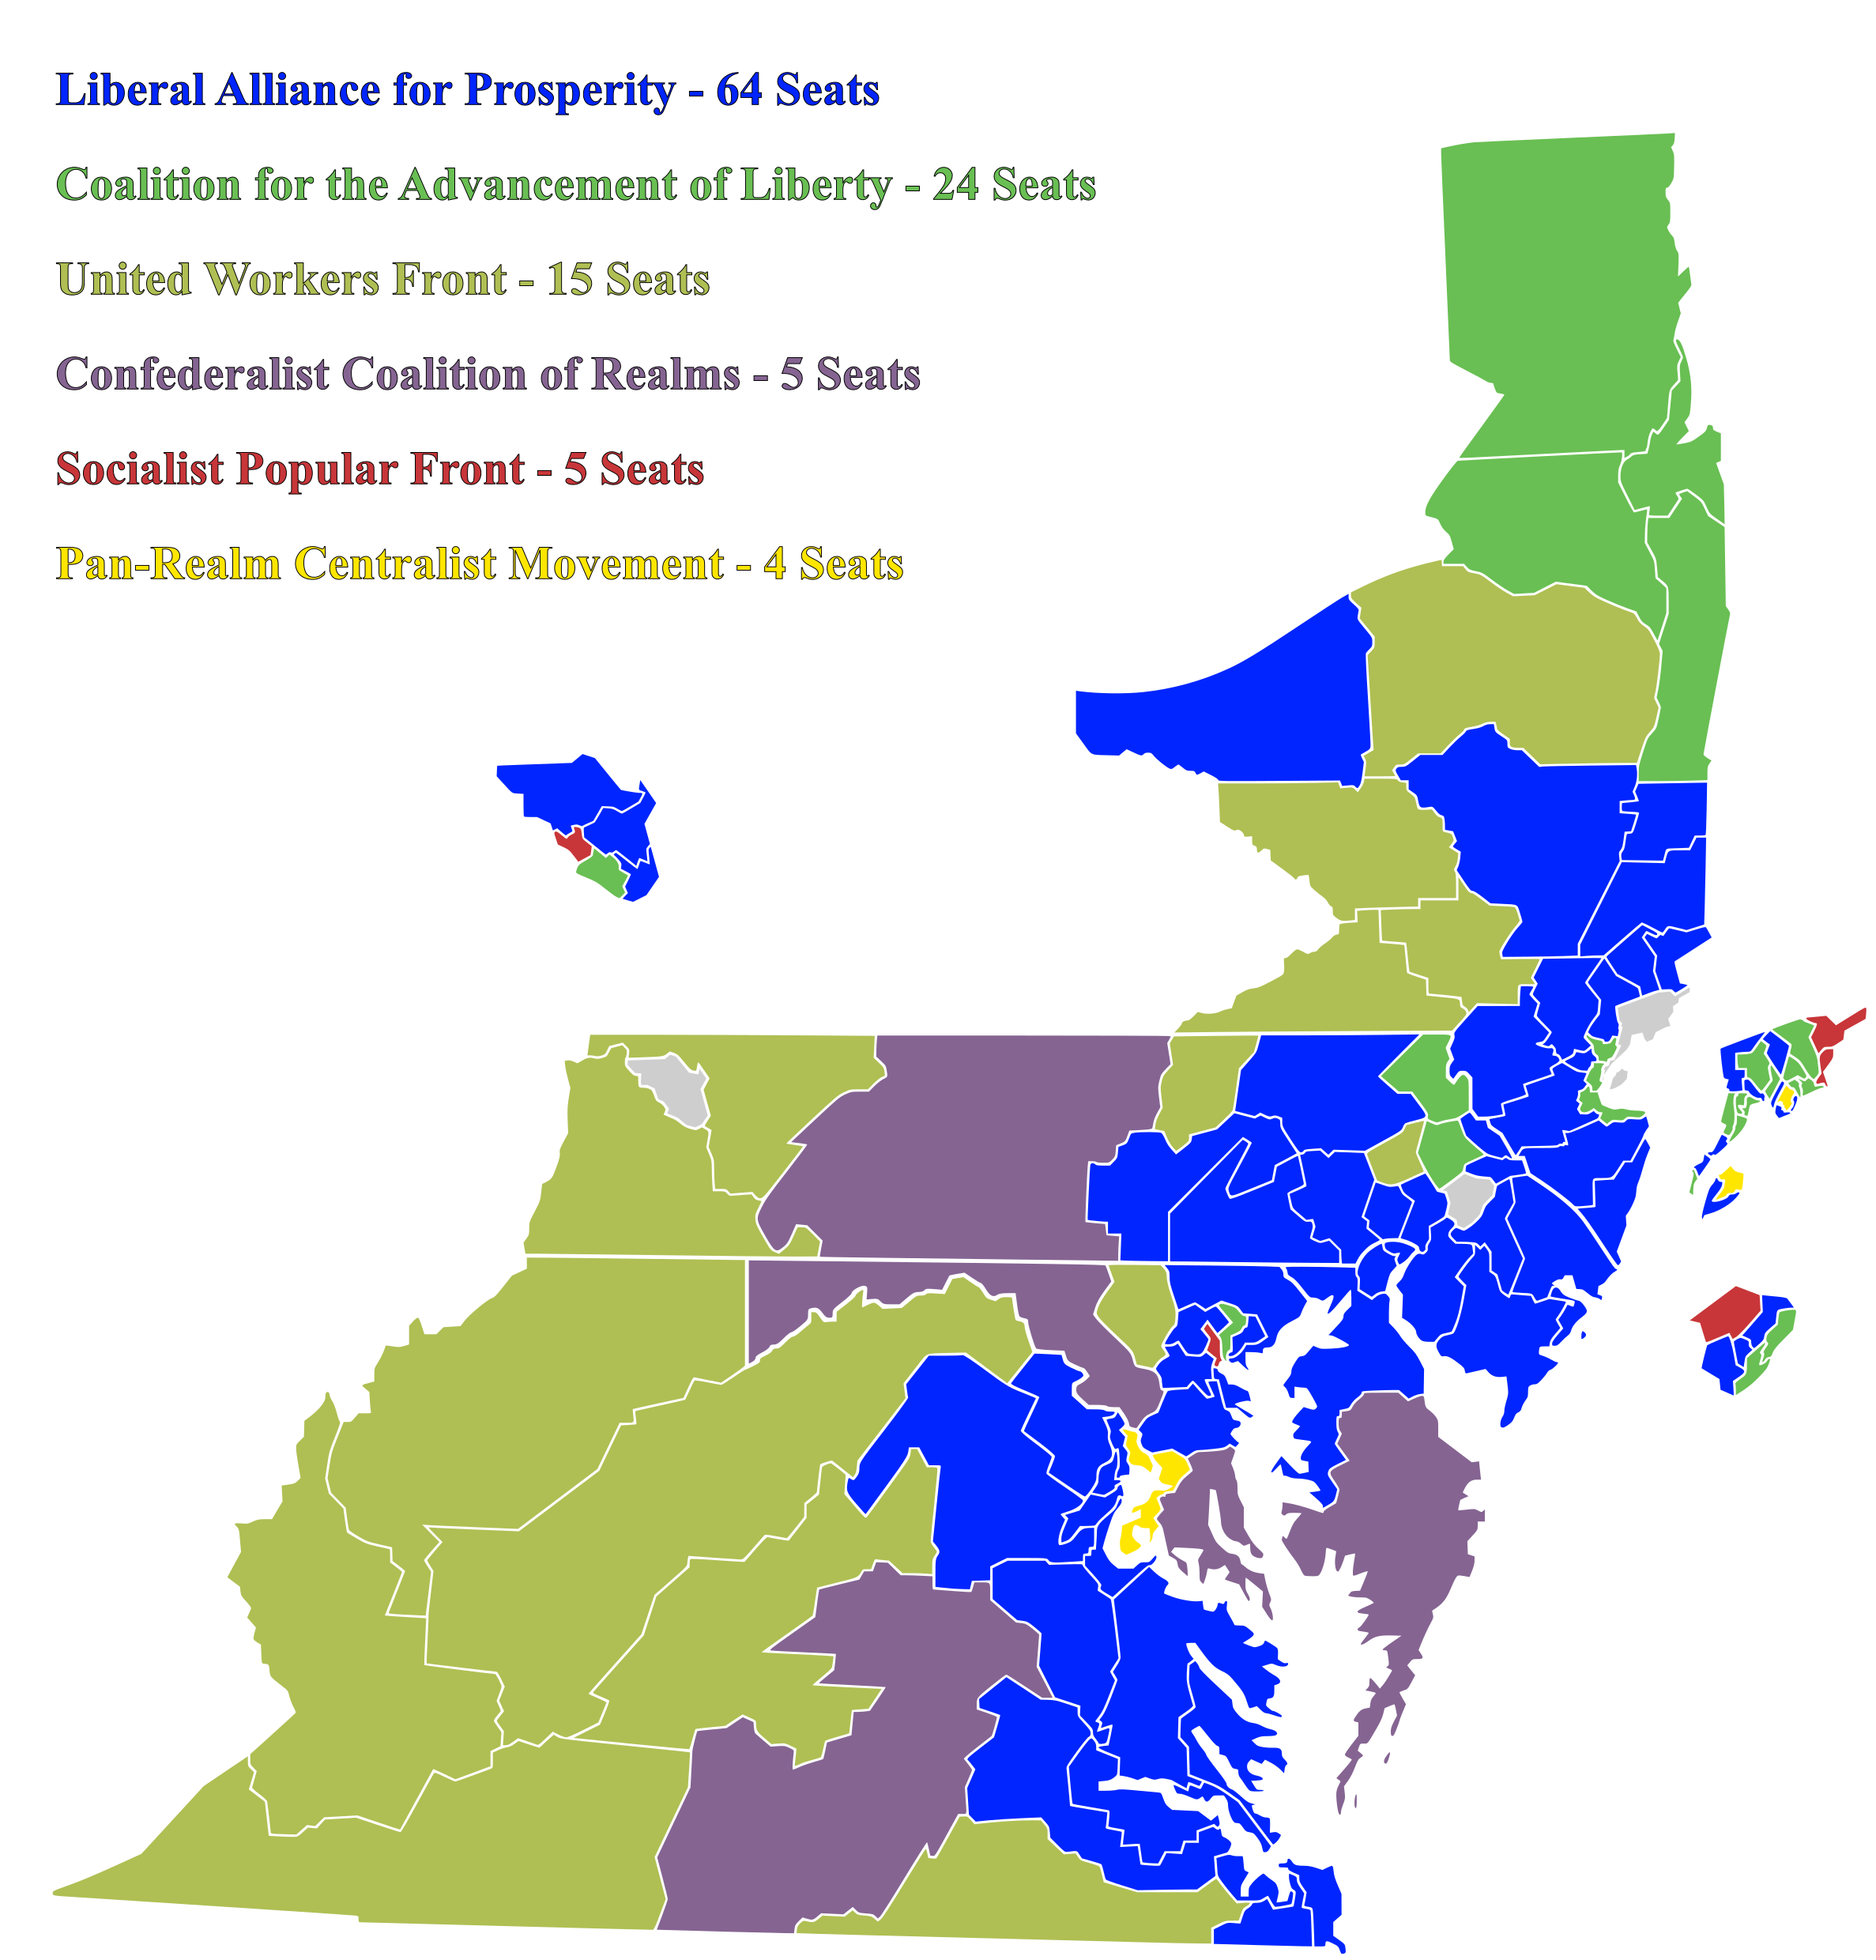
Today, the UK has 3 levels of elected office in each of its nations, as well as in the County of Middlesex, the seat of the union's capital city London, which has had its own assembly separate from Mercia since 1965; local councils for each district of a nation, the National Assembly of each nation (except the County of Middlesex, where it is simply known as the Middlesex Assembly); and the House of Commons of the United Kingdom, where 750 members are elected across every constituent country. The national assembly has the strongest powers, and can overrule other governments if they seek to overstep their bounds on issues such as taxation or social policy (most notably doing so to Middlesex and Northumbria in 1985 when both had aggressively resisted the Thatcher government's monetarist economic policies, and to Essex and Kent in 2014 when they attempted to install unilateral restrictions on immigration).

Each region has its own different political climate and history, and the UK of this world is not quite the same as that of our own for that reason.

(Like the American Federation TL, I have some ideas for national election maps for this setup which I plan to post soon.)
 
Further maps of the first and second largest parties in my RNG US House.

197 Democrats
3 Democratic-Farmer-Labor

184 Republicans
5 Federalist
9 VACANT
11 Anti-Jacksonian
18 Democratic-Republican
3 Crawford Democratic-Republican
1 Adams-Clay Democratic-Republican
6 Jacksonian
3 Anti-Masonic
2 Pro-Administration
1 Anti-Administration
2 Independent Democratic
2 Opposition
1 Populist
4 Whig
1 Unionist


map1.png

map2.png
 
I was wondering if you wouldn't mind taking a request. Could you do a map of Colorado if Stapleton had gotten 75% of the vote against Polis last year? I was just curious to see how it would look.

@Tex Arkana, looking through my old posts, I don't believe you ever responded to this request. Obviously, this map would have to be posted on the Current Politics map thread.
 
Britain will be better: Labour Wins in 2015

LAB: 294 (32.7%)
CON: 274 (32.9%)
SNP: 44 (3.6%)
LDM: 16 (8.8%)
DUP: 8
SFN: 4
PLC: 3
SDLP: 3
UUP: 2
GRN: 1 (4.7%)
IND: 1

*Brackets = Major party % share of UK vote

nykGLjQ.png
 
Now part 2 of 3 of the Ultimate United States of America.

Ulimate election 2004.png

2004: Bushlandia
Conservative: President Geroge W Bush (TX)/Vice President Michel Roquejeoffre (FR): 50.7% Popular vote
Labor: Fmr Governor Nelson Mandela (SA)/Fmr Governor Howard Dean (VT): 26.5% Popular vote
Liberal Democrat: Governor Anders Fogh Rasmussen (DK)/Senator John Edwards (NC): 22.8% Popular vote

Ulimate election 2008.png

2008: Obamanation
Liberal Democrat: Senator Barrack Obama (IL)/Fmr Governor Tony Blair (EG): 52.9% Popular
Conservative: Senator John Mccain (AZ)/Governor Arnold Schwarzenegger (CA): 36.2% Popular
Labor: Representative Joschka Fischer (DE)/Representative Naoto Kan (JP): 10.9% Popular

Ulimate election 2012.png
2012: The Center holds
Liberal Democrat: President Barrack Obama (IL)/Vice President Tony Blair (EG): 51.1% Popular vote
Conservative: Governor David Cameron (EG)/Senator Stephen Harper (AB): 37% Popular vote
Labor: Governor François Hollande (FR)/Senator Bernie Sanders (VT): 11.9% Popular vote
 
From the UAR-verse
ddit4e7-0de59f6f-9a66-4c8c-97be-4cda45ea9dad.png

The seats of the Middle Atlantic region as per the 2018 Confederal Assembly elections. The Confederal Assembly holds elections every six years. The current session of the assembly runs from 2019-2025. Like in the nation as a whole, the Liberal Alliance for Prosperity (LAP) holds the most seats in the region.
 
Top