City of Falls Church is only about 2 sq mi.Try living there
You are using an out of date browser. It may not display this or other websites correctly.
You should upgrade or use an alternative browser.
You should upgrade or use an alternative browser.
Alternate Electoral Maps II
- Thread starter Aaaaasima
- Start date
- Status
- Not open for further replies.
Threadmarks
View all 43 threadmarks
Reader mode
Reader mode
Recent threadmarks
Pericles-Obama landslide in 2008 Pericles-Obama does better in 2012 Tex Arkana-Carter runs a better campaign in 1976 and picks Frank Church as his running mate, winning in a landslide. DPKdebator-Trump landslide in 2016 wildviper121-Trump landslide based off of someone's Campaign trail game DPKdebator-The worst you can do as Hillary Clinton in the campaign trail game TheSaint1950-Last gallup poll in 1948 is right jonnguy2016-Trump self-sabotageWhat year would this be?The Greatest Show on Earth
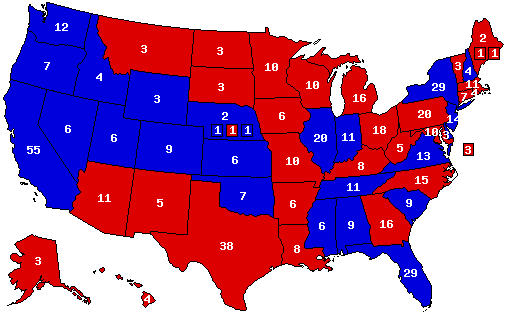
"They said it couldn't be done but ladies and gentlemen of America, we did it!" -President Elect Robert James Ritchie
Sen. Robert Ritchie/ Gov. Boyd Rutherford (Republican) 280 EV, 42.5%
Sen. Martin Heinrich/ Rep. Stacey Abrams (Democratic) 256 EV, 40.1%
Unfortunately, I did not save the map configuration.
I went back to the map you created, and reflected on some of it. I made some modifications, to make it fit more in accord with my timeline. Here is the revised version:
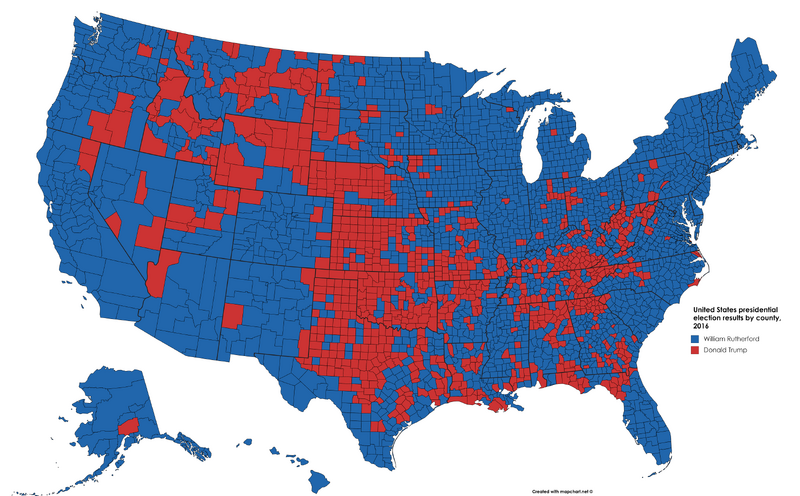
For Nevada, I used Democratic maps from several decades ago, and for Colorado, I kept the four most Republican counties in the state from 2008 Republican, considering that Johnson won all but three counties in 1964 with 61%, whereas here, the Democrat gets 63%. I also gave the Democrats that one county in New York, since the state goes 73% Democratic, and Johnson won every county with 69% in 1964. In Pennsylvania, I gave all but the five most Republican counties in 2016 to the Democrats, again reflecting 1964 (since the Democratic percentage is not that much lower than Johnson's).
But otherwise, I retained your map, especially for the close states (though in Kentucky I did give historically Democratic Elliott County back to the Democrats). I am especially fascinated by Oklahoma, Tennessee, Alabama, Indiana, Nebraska, and Kansas, seeing how Democrats win those states (except for Oklahoma) with a minority of the counties carried. As for the white vote, how would it go in each state with this county map? What about congressional districts? Which ones would still be Republican?
Last edited:
Since there's so many Democratic landslides being posted, I ought to balance things out a little bit:

Since there's so many Democratic landslides being posted, I ought to balance things out a little bit:
View attachment 346028
I personally enjoy Democratic landslide maps more, not because I favor Democrats (In fact, I've only voted for one Democrat for President in my lifetime), but because normally Democrats don't win that many counties so it's interesting to see what a D landslide would look like on the county level.
I like your map here as well, but I'd add that Harris County should definitely be red.
I went back to the map you created, and reflected on some of it. I made some modifications, to make it fit more in accord with my timeline. Here is the revised version:
As you can see, I gave the Democrats more counties in Nevada, Colorado, Missouri, Texas, Oregon, and Illinois, along with a smattering in a few other states. In Missouri, I used Claire McCaskill's victory map from 2012, since her margin of victory was almost identical to that rendered by the scenario. In Texas, I used the map from 2008, giving the Democrat counties where McCain won with less than 70% of the vote (though of course, most of the rock-solid Republican counties remain so). The map, therefore, looks similar to that of 1976, when Carter won the state, or those of the 1990s, when Bill Clinton managed to still win a good number of rural counties. In Oregon I gave the Democrat more because Democrats in the not-too distant past won the same number or more of counties with greater than 60%. For Illinois, I used Dick Durbin's victory map from 2008, when he won all but four counties with 67%, about the same percentage as in this scenario. For
Nevada, I used Democratic maps from several decades ago, and for Colorado, I kept the six most Republican counties in the state from 2008 Republican, considering that Johnson won all but three counties in 1964 with 61%, whereas here, the Democrat gets 63%. I also gave the Democrats that one county in New York, since the state goes 72% Democratic, and Johnson won every county with 69% in 1964. In Pennsylvania, I gave all but the four most Republican counties in 2016 to the Democrats, again reflecting 1964 (since the Democratic percentage is not that much lower than Johnson's).
But otherwise, I retained your map, especially for the close states (though in Kentucky I did give historically Democratic Elliott County back to the Democrats). I am especially fascinated by Oklahoma, Tennessee, Alabama, Indiana, Nebraska, and Kansas, seeing how Democrats win those states (except for Oklahoma) with a minority of the counties carried. As for the white vote, how would it go in each state with this county map? What about congressional districts? Which ones would still be Republican?
This is a nice map. I could see these results in such a massive landslide, because I don't believe in universal swings, and I'm of the thought that it's easier to win back counties that you once had rather than win counties you've basically never had.
It is funny that, on this map, Mississippi and Texas look like the bluest statesSince there's so many Democratic landslides being posted, I ought to balance things out a little bit:
View attachment 346028

Me too, it is more interesting. Also, it is sad to me that the party of common man (The party of Jackson, Jennings Bryan and Kennedy) has become the elitist party of big cities only. That's why I like making blue maps.I personally enjoy Democratic landslide maps more, not because I favor Democrats (In fact, I've only voted for one Democrat for President in my lifetime), but because normally Democrats don't win that many counties so it's interesting to see what a D landslide would look like on the county level.
I like your map here as well, but I'd add that Harris County should definitely be red.
I see. What about the white vote and congressional districts? How would those change from those posted earlier.This is a nice map. I could see these results in such a massive landslide, because I don't believe in universal swings, and I'm of the thought that it's easier to win back counties that you once had rather than win counties you've basically never had.
Good map. I imagine this would be what the map would have looked like if Trump had won a landslide last year.Since there's so many Democratic landslides being posted, I ought to balance things out a little bit:
View attachment 346028
I see. What about the white vote and congressional districts? How would those change from those posted earlier.
Rutherford likely wins the White vote in every state except for the Deep South, North Carolina, Wyoming, Oklahoma, and Texas.
Rutherford likely wins the White vote in every state except for the Deep South, North Carolina, Wyoming, Oklahoma, and Texas.
I see. So I guess Trump carries it in North Carolina, Georgia, South Carolina (?, because of all but two counties going Democratic), Alabama, Mississippi, Louisiana, Texas, Wyoming, and Oklahoma. I would also imagine that the Republican-carried congressional districts would be concentrated in the Deep South and in the "middle spine", from Nebraska to Texas. Though I am not sure about several of them, particularly the ones in Texas, Kentucky, Tennessee, West Virginia, Arkansas, and Kansas.
Last edited:
I see. So I guess Trump carries it in North Carolina, Georgia, South Carolina (?, because of all but two counties going Democratic), Alabama, Mississippi, Louisiana, Texas, North Carolina, Wyoming, and Oklahoma. I would also imagine that the Republican-carried congressional districts would be concentrated in the Deep South and in the "middle spine", from Nebraska to Kansas. Though I am not sure about several of them, particularly the ones in Texas, Kentucky, Tennessee, West Virginia, Arkansas, and Kansas.
It's probably plausible that he doesn't win the white vote in South Carolina, even though he sweeps all but two counties. he probably gets around 42-43% of the white vote and 96-97% of the black vote, due to racial polarization.
That is understandable. And I believe that he would have lost it in Arkansas as well, and possibly even Tennessee, given the closeness of those states. I also think that he might have lost it in Missouri and maybe even Indiana. Kentucky and West Virginia, I imagine, would see very narrow Democratic victories among whites as well.It's probably plausible that he doesn't win the white vote in South Carolina, even though he sweeps all but two counties. he probably gets around ~40% of the white vote and 96-97% of the black vote, due to racial polarization.
Yet another random realignment map. this represents a tied election, with the most GOP states being Wyoming, Iowa, and Utah, but with the most Democratic states being Mississippi, Texas, Kentucky, and Georgia.
Baker vs. Manchin?
Yet another random realignment map. this represents a tied election, with the most GOP states being Wyoming and Utah (Much like they are curently), but with the most Democratic states being Mississippi, Texas, Kentucky, and Georgia.
Baker vs. Manchin?
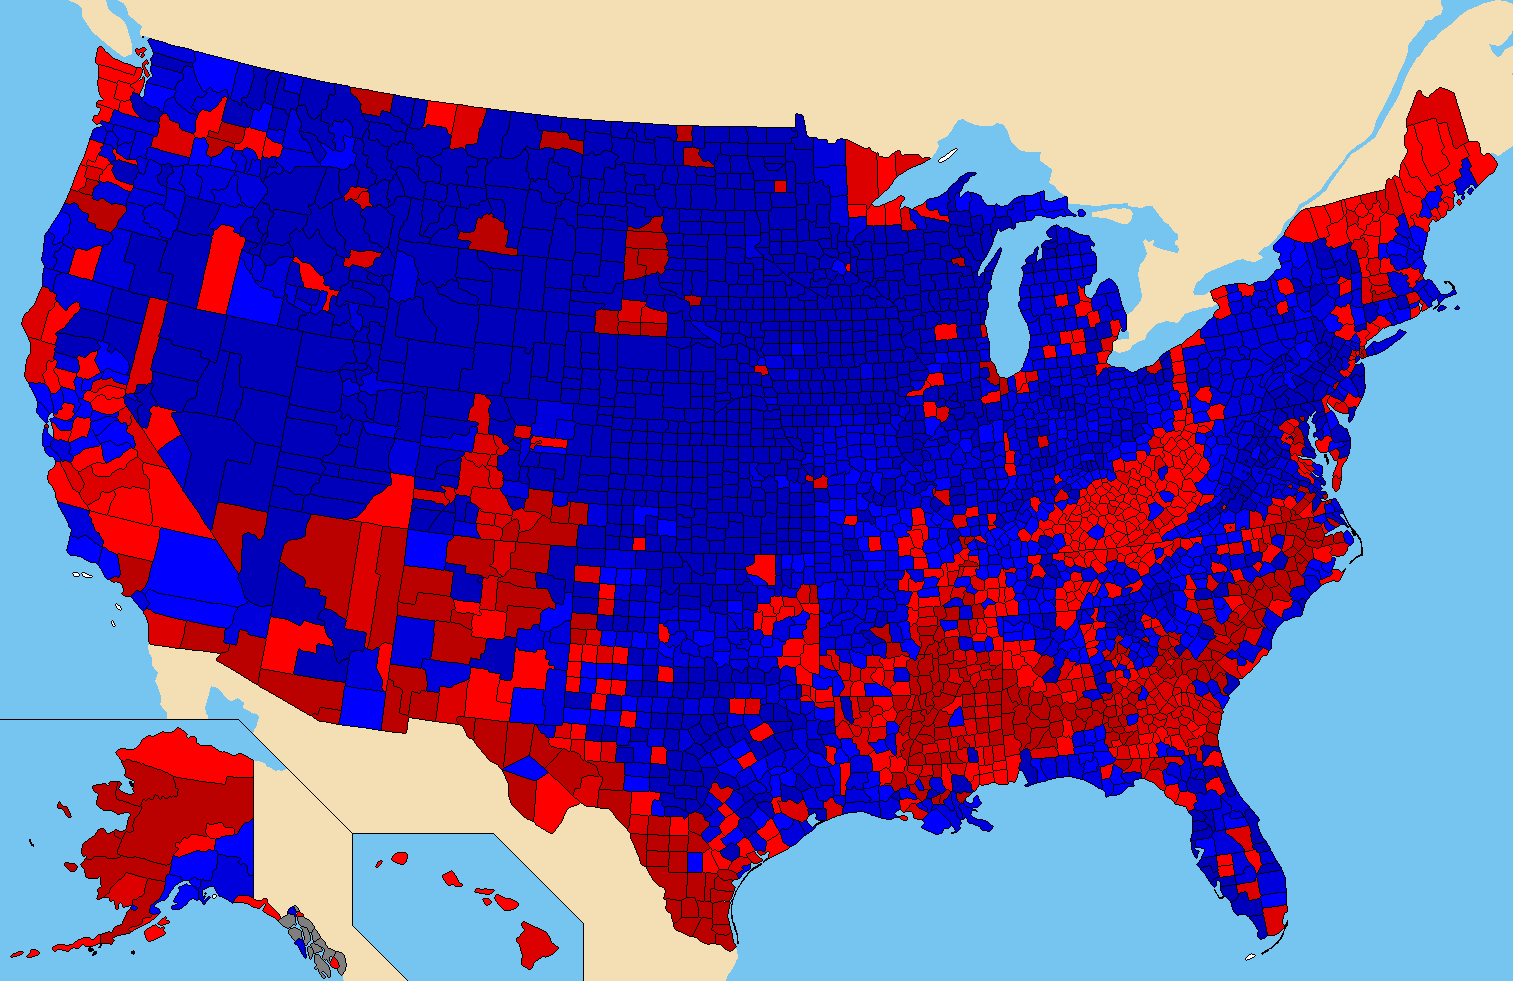
Firstly, I didn't make this map, so I should give credit to the USElectionAtlas.org user whose name I can't remember at the moment... nice job, dude/dudette.
But anyway, the basic idea behind this is that minorities vote as they currently do, but turn out at a much higher rate, while the Dems make huge gains with the WWC voters and the GOP makes big gains with the wealthy and Asians as well as upper-class blacks and Hispanics. it's sort of like this map that I made:
I'm not sure what's going on in Eastern Kentucky that turns Leslie County atlas red, though.
It is a very interesting map. I like it because it is something new and different. Although, I still think that Dakotas would stay R while some other states DFirstly, I didn't make this map, so I should give credit to the USElectionAtlas.org user whose name I can't remember at the moment... nice job, dude/dudette.
But anyway, the basic idea behind this is that minorities vote as they currently do, but turn out at a much higher rate, while the Dems make huge gains with the WWC voters and the GOP makes big gains with the wealthy and Asians as well as upper-class blacks and Hispanics. it's sort of like this map that I made:
Btw, Baker vs. Manchin was I joke.
It is a very interesting map. I like it because it is something new and different. Although, I still think that Dakotas would stay R while some other states D
I would say something in-between my map and their map would be more accurate, but I'm not so sure that either scenario is likely.
Changes happen, but slowly.I would say something in-between my map and their map would be more accurate, but I'm not so sure that either scenario is likely.
Changes happen, but slowly.
This would require a near reversal of current trends though, but of course things like that have happened a few times in the past.
Threadmarks
View all 43 threadmarks
Reader mode
Reader mode
Recent threadmarks
Pericles-Obama landslide in 2008 Pericles-Obama does better in 2012 Tex Arkana-Carter runs a better campaign in 1976 and picks Frank Church as his running mate, winning in a landslide. DPKdebator-Trump landslide in 2016 wildviper121-Trump landslide based off of someone's Campaign trail game DPKdebator-The worst you can do as Hillary Clinton in the campaign trail game TheSaint1950-Last gallup poll in 1948 is right jonnguy2016-Trump self-sabotage- Status
- Not open for further replies.
Share: