1936 and 1972 PV totals applied to the 2016 election:
1936 (D+21.17):
Hillary Clinton / Tim Kaine - 60.8%, 476 EVs
Donald Trump / Mike Pence - 36.54%, 62 EVs
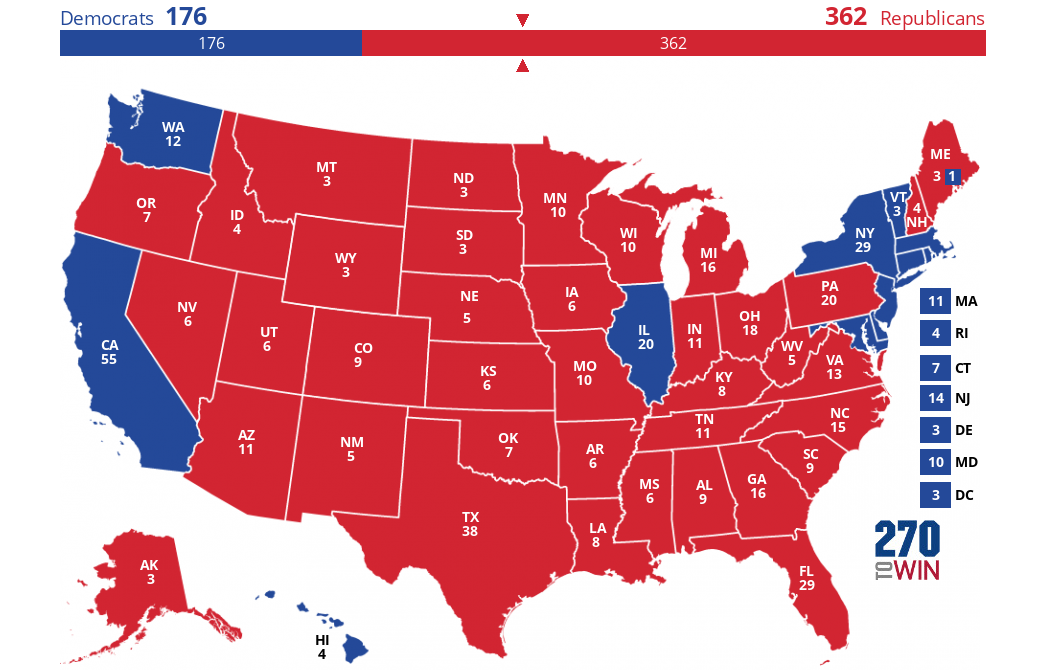
1972 (R+25.54%):
Donald Trump / Mike Pence - 60.67%, 452 EVs
Hillary Clinton / Tim Kaine - 37.52%, 86 EVs
All right, here's 2016 counties with 1936 PV:
So, I finally got around to making a county map for 2016-with-1972-PV:
This managed to be a pretty huge blowout, with the 25% swing flipping all but the bluest counties in the country. Five states (MA, VT, MD, CA, and HI as well as DC) vote for Hillary, but only California, Hawaii, and DC are a majority.
States where Trump wins every county: New Hampshire, Rhode Island (not a joke), Connecticut, West Virginia, Kentucky, Indiana, Oklahoma, Nebraska, Utah, Nevada, and Alaska (not 100% sure though)
States where Trump wins all but one county: Maine, Pennsylvania, Delaware, Illinois, Iowa, Missouri, Wyoming, Montana, and Idaho
Also made a nicer-looking national map:
Donald Trump / Mike Pence - 60.67%, 452 EVs
Hillary Clinton / Tim Kaine - 37.52%, 86 EVs