I had a feeling that I wasn't doing something right. In that case, would I have to add in all of the minor-party totals to Clinton's popular-vote percentage?What you did here is combine everyone who didn't vote for Clinton or Bush with Clinton, not just Perot. I'm actually working on my own county map for this but with only Clinton + Perot combined and with shaded margins. In my map Bush picks up some counties with a narrow plurality compared to yours because Perot's votes weren't enough to get Clinton to a plurality when you count other third parties.
You are using an out of date browser. It may not display this or other websites correctly.
You should upgrade or use an alternative browser.
You should upgrade or use an alternative browser.
Alternate Electoral Maps II
- Thread starter Aaaaasima
- Start date
- Status
- Not open for further replies.
Threadmarks
View all 43 threadmarks
Reader mode
Reader mode
Recent threadmarks
Pericles-Obama landslide in 2008 Pericles-Obama does better in 2012 Tex Arkana-Carter runs a better campaign in 1976 and picks Frank Church as his running mate, winning in a landslide. DPKdebator-Trump landslide in 2016 wildviper121-Trump landslide based off of someone's Campaign trail game DPKdebator-The worst you can do as Hillary Clinton in the campaign trail game TheSaint1950-Last gallup poll in 1948 is right jonnguy2016-Trump self-sabotageIf you want to add everyone who didn't vote for Bush to Clinton, yes. My map is just Clinton + Perot but I might make another one at some point with Clinton + every third party.I had a feeling that I wasn't doing something right. In that case, would I have to add in all of the minor-party totals to Clinton's popular-vote percentage?
I see. I will work on revising those figures.If you want to add everyone who didn't vote for Bush to Clinton, yes. My map is just Clinton + Perot but I might make another one at some point with Clinton + every third party.
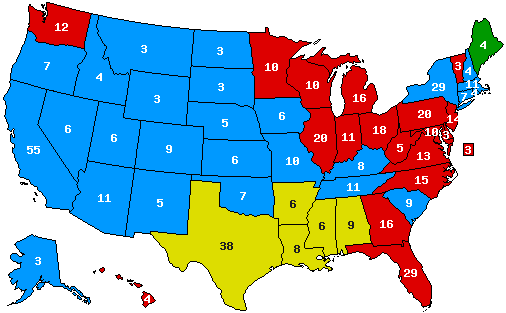
Taking into account what Tex Arkana said, here is a revised version of the 1992 Alternate Election Scenario. The following is a state map of what that election would have looked like if all third-party votes from that year (Perot, Marrou, Gritz, Fulani, Philips, and minor/write-in candidates) had gone to the Democratic ticket. As can be seen, the Democrat (Clinton for this post's sake), would have won all fifty states:
Governor William Jefferson Clinton (D-AR)/Senator Albert Gore, Jr. (D-TN)-62.54%-538 EV
President George H.W. Bush (R-TX)/Senator Danforth Quayle (R-IN)-37.45%-0 EV
And the corresponding county map:
And here are the revised "interesting statistics" about this scenario:
The revised table is here: https://en.wikipedia.org/wiki/User:The_Empire_of_History/sandbox/6.
Governor William Jefferson Clinton (D-AR)/Senator Albert Gore, Jr. (D-TN)-62.54%-538 EV
President George H.W. Bush (R-TX)/Senator Danforth Quayle (R-IN)-37.45%-0 EV
And the corresponding county map:
And here are the revised "interesting statistics" about this scenario:
- Clinton would receive more than 60% of the vote in 29 states. Among the most surprising of these would be Arizona, Kansas, Montana, and Wyoming. Interestingly enough, Clinton would fail to break 60% in three other notable states-Florida, Texas, and New Jersey-with the last being the most puzzling. The former two, however, are not in hindsight, given that both Florida and Texas were (and continue to be), Republican-leaning states in 1992, that they were held by Bush narrowly that year in OTL, and that Bush's adoptive home state is Texas. Nevertheless, Clinton would win both states with ~59% of the vote, and New Jersey with the same share. He would win Dan Quayle's home state of Indiana with ~57%.
- Clinton receives greater than 70% of the vote in Massachusetts and Rhode Island, Ronald Reagan's weakest state wins in 1984, and cracks 90% in the District of Columbia.
- Clinton would receive ~65% of the vote in his home state of Arkansas, but only 58% in Al Gore's home state of Tennessee.
- He would win every county in 15 states, four short of Richard Nixon's county-sweep record in 1972. New York, however, would not be one of them: Bush holds Hamilton County.
- Mississippi would be the closest state in the election, going for Clinton by 0.64%. It would be almost as close as Minnesota was in 1984. Clinton would receive an absolute majority, but barely: 50.32%. Minnesota itself goes 68% Democratic in this scenario.
The revised table is here: https://en.wikipedia.org/wiki/User:The_Empire_of_History/sandbox/6.
Last edited:
After a lot of digging, I've found evidence that the 1992 vote in Nebraska was as follows
Clinton: 57,467
Bush: 121,342
Other: 65,473
Bush: 121,342
ATL Clinton: 122,940
So Clinton wins Nebraska's 3rd District, by a narrow 1,598 (0.65%) margin.
Clinton: 57,467
Bush: 121,342
Other: 65,473
Bush: 121,342
ATL Clinton: 122,940
So Clinton wins Nebraska's 3rd District, by a narrow 1,598 (0.65%) margin.
Based on the county map here, how does Clinton win NE-3? Like, I'd be interesting in seeing some sort of breakdown because it still appears to be a GOP win to me.After a lot of digging, I've found evidence that the 1992 vote in Nebraska was as follows
Clinton: 57,467
Bush: 121,342
Other: 65,473
Bush: 121,342
ATL Clinton: 122,940
So Clinton wins Nebraska's 3rd District, by a narrow 1,598 (0.65%) margin.
Thank you for doing these calculations. I will revise my post accordingly.After a lot of digging, I've found evidence that the 1992 vote in Nebraska was as follows
Clinton: 57,467
Bush: 121,342
Other: 65,473
Bush: 121,342
ATL Clinton: 122,940
So Clinton wins Nebraska's 3rd District, by a narrow 1,598 (0.65%) margin.
My problem with Sherrod Brown is that he has a terrible speaking voice
I don't know what you're talking about. He's just got a raspy, husky voice is all, and to my working-class ears I find it rather appealing.
Here's an idea I've come up with. When the London Assembly was created in 2000, they came up with the idea of large multi borough constituencies and a London wide region. This differed from the idea of the Westminster seats and several regions that Wales and Scotland have.
What if they had followed Scotland and Wales and had small constituencies and numerous regions? The following is that!
I've based my seats on the '83 boundaries since the '97 ones crossed borough boundaries and to this day it causes squabbles. All my seats are made up of the current electoral wards.
2016 Results
Labour 61
Conservative 41
Green 9
Lib Dem 7
UKIP 7
Women's Equality 1
Maps (coloured in by Majority unless stated otherwise) - credit to those who made the map and the key
Mayoral results by constituency

Mayoral 2nd Preferences by constituency

Constituency results

Regional results by constituency

Constituency result by winning party

Regional results

What if they had followed Scotland and Wales and had small constituencies and numerous regions? The following is that!
I've based my seats on the '83 boundaries since the '97 ones crossed borough boundaries and to this day it causes squabbles. All my seats are made up of the current electoral wards.
2016 Results
Labour 61
Conservative 41
Green 9
Lib Dem 7
UKIP 7
Women's Equality 1
Maps (coloured in by Majority unless stated otherwise) - credit to those who made the map and the key
Mayoral results by constituency
Mayoral 2nd Preferences by constituency
Constituency results
Regional results by constituency
Constituency result by winning party
Regional results
Last edited:
If they do it like Wales and Scotland, they'd use the Euro-constituencies.
Wales and Scotland don't use the Euro Constituencies. Yes, the regions are similar but they are made up of different constituencies (Tayside North for example was part of the NE Scotland Euro constituency and part of the Mid Scotland and Fife Holyrood region).
Using my ideal US parties, I came up with my own version of 2020 election. Whoever wins the most electoral votes is the winner because the Federalists decided amend the Constitution after the chaotic 1968 election where no one won 270 electoral votes. This is the closest election since 1976.
John Kasich (F-OH)/Bill Weld (F-MA) - 235 EVs - 36.1%
Bernie Sanders (W-VT)/Nina Turner (W-OH) - 232 EVs - 36.7%
Ted Cruz (DC-TX)/Mike Pence (DC-IN) - 67 EVs - 16.9%
Jill Stein (DDN-MA)/Various - 4 EVs - 9.0%
Vote splitting in the South gave states like Georgia and Florida, which have gone Federalist for years, to the Workers' Party. Vote splitting in the North gave Maine, which has been a Federalist stronghold, to the new Direct Democracy Now Party. After Sanders won the popular vote by 0.6% and lost by just 3 electoral votes, he requested recounts in California, Colorado, Oregon, New York, and Missouri. The recounts are still ongoing, but as of right now incumbent President John Kasich is the winner. The House and Senate, which are both controlled by the Federalist Party, will declare the winner in a month, regardless of if the recount is complete or not.
Best results for the Workers' Party by state
1. West Virginia - 54.1%
2. Vermont - 52.0%
3. Hawaii - 50.3%
Best results for the Federalist Party by state
1. Utah - 51.8%
2. New Hampshire - 50.5%
3. Massachusetts - 47.1%
Best results for the Democratic Christian Party by state
1. Alabama - 57.2%
2. Louisiana - 56.9%
3. Mississippi - 56.1%
Best results for the Direct Democracy Now Party by state
1. Maine - 36.2%
2. Massachusetts - 14.3%
3. California - 14.1%
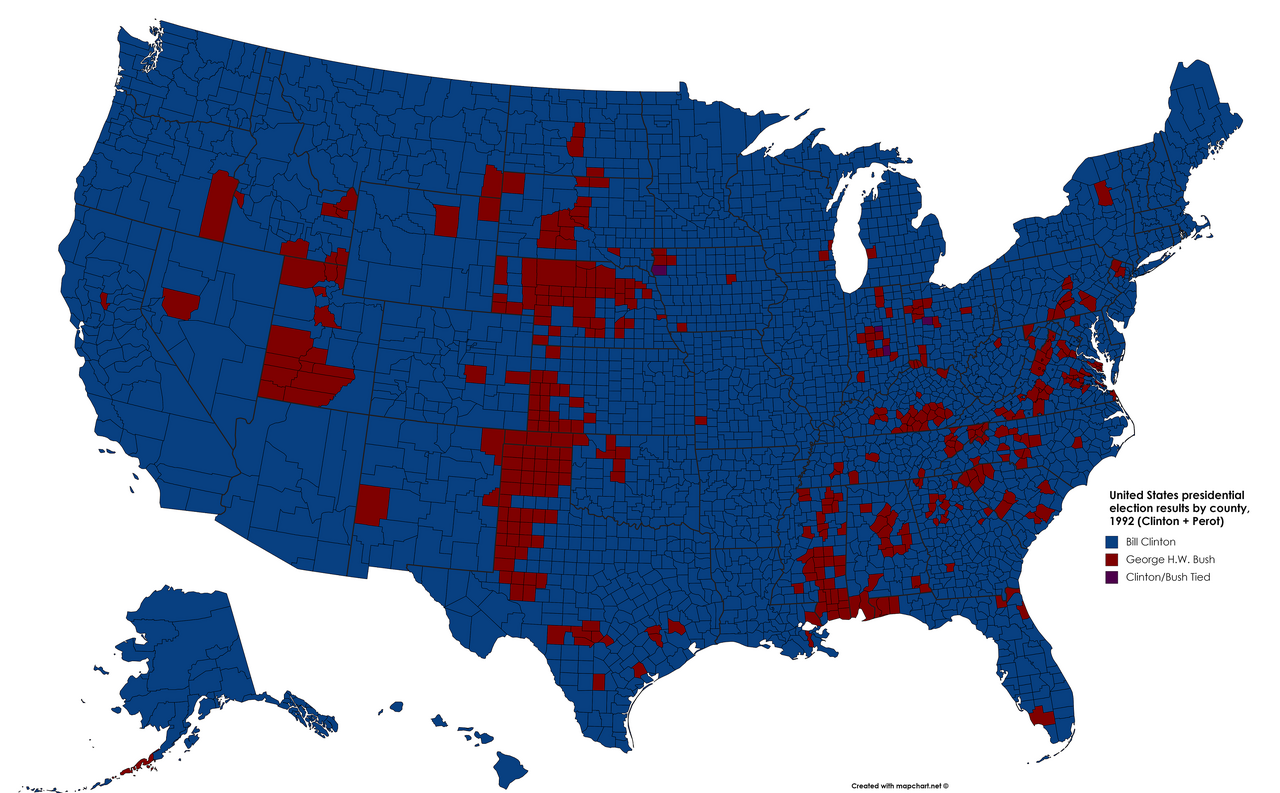
Here's 1992 if everyone who voted for Ross Perot had voted for Clinton instead, unlike Calthrina's map, I only combined Clinton and Perot, which is why some counties are still won with a plurality due to other third parties. four counties are exactly tied between Clinton and Bush.

The Hope Of America: 1992
1996
The events of Brown's first term saw a dramatic upheaval of economic policy. Upon assuming office, he worked with the Democratic majority in Congress to raise corporation tax, eliminate loopholes in the system, and replace the US's sales tax with a value added tax system, all of which worked to reduce consumer costs and played fairly well with voters. While these had been part of Brown's agenda in the first place, he emphasized these as a prefix of sorts to the vote on NAFTA, trying to distance himself from a potential vote in favour of the agreement from Congress; in October 1993, he declared that 'on the current terms, I personally cannot abide NAFTA. I hope that forces in our neighbouring countries will reconsider the impact of this agreement and its ramifications for poorer people across the Americas.' In mid-November, newly elected Canadian Prime Minister Jean Chrétien, who was more friendly to Brown's policy on NAFTA than the two previous PC premiers had been, agreed to rescind the Treaty after efforts to renegotiate it and its terms were found to be taking too long to agree on, with a decision being required for a Senate vote pencilled in in December; that vote was never held, as NAFTA fell through, though the existing Canada-US Free Trade Agreement stayed.
Republicans and free-trade Democrats were outraged, with House Minority Leader Bob Michel famously declaring 'President Brown has just thrown America's economy off a cliff while claiming he will save it'. The infighting within the Democrats proved an embarrassment, and the emergence of conservative firebrand Newt Gingrich as Republican leader in the House appealed to conservative votes who affiliated with both parties. Due to a mix of disunity and poor turnout from Democrats and conservative engagement with the Republican plans to try to cut 'government waste' and reduce the deficit, the Republicans took back control of the House and Senate in the 1994 midterms.
However, this effectively brought the party straight onto the firing line. Gingrich quickly acquired a reputation for focusing less on wastage and more on partisan restriction. He and Brown loathed each other, and when Brown refused to deviate from his spending pledges in the 1995 budget, opposing aspects such as increasing Medicare premiums and limiting the scope of environmental regulation, the Republicans instigated a government shutdown; Brown comically remarked to the press, 'I suppose if the government doesn't do anything, it can't waste anything.' Voters came to see Gingrich as a self-motivated opportunist, and as public opinion turned against him, the act establishing his Temporary Assistance to Needy Families plan had to be heavily amended, actively preventing states from eliminating welfare provisions and ensuring recipients were properly informed of appointments for meetings concerning welfare rolls.
Further hampering the Republicans was an alleged conversation between Gingrich and Brown in which, in response to Brown stating that 'these cuts will put millions into poverty,' Gingrich asserted, 'Why does that matter if it gets the deficit down?' Using these accounts and the shutdown, Brown was able to present the Republicans as trying to deprive poor Americans of security, claiming that Republican tax cuts would 'blow a hole in the deficit', which had been doing fairly well during this period of economic recovery, as well as striking a populist note by suggesting the Republicans 'want these things for the same reasons they wanted NAFTA: to make more money for themselves and less money for the man on the street'.
The Republican primaries, seen as an uphill battle for any potential candidate due to their unpopularity in Congress, saw several senior figures like Senate Majority Leader Bob Dole of Kansas and Senator Richard Lugar of Indiana come forward, although the figure to particularly catch on with primary voters was dark horse Representative Bob Dornan of California, an outspoken conservative who seemed to care more for attacking Brown than winning. His running mate was Senator Bob Smith of New Hampshire, who was little different ideologically, although he did provide a regional balance to the ticket.
Unsurprisingly, the campaign was fairly easy for Brown, whose campaign successfully portrayed Dornan as a clone of Gingrich, most notably stating 'There are plenty of Republicans I'm willing to work with. It's a pity most of them are being downtrodden by extremists who only care for big business.'
On election day, it seemed like most people agreed with his assessment.
Brown/Harkin (Democratic): 382 EVs, 53.8%
Dornan/Smith (Republican): 156 EVs, 45.3%
The result was a distinct increase in Brown's margin from 1992 in both the popular vote and the electoral vote, in conjunction with Democrats recapturing both houses of Congress, decapitating several Republican firebrands in the process. Democrats celebrated the result as an endorsement of the President over an extremist Congress, but some grievances still remained with Brown; these manifested more in the low turnout than through any particular display of voting against him, with turnout almost slipping below 50% for the first time in 72 years.
The Republicans would be left licking their wounds, but a 'quiet revolution', as it would be known, was on the horizon.
Very good job! I will go back and revise what I've done to reflect this. My intention was for this kind of scenario; I had made my prior map based off guesswork. Also, how many counties does Bush win here?Here's 1992 if everyone who voted for Ross Perot had voted for Clinton instead, unlike Calthrina's map, I only combined Clinton and Perot, which is why some counties are still won with a plurality due to other third parties. four counties are exactly tied between Clinton and Bush.
Jeb Bush unfortunately does not win any counties.Very good job! I will go back and revise what I've done to reflect this. My intention was for this kind of scenario; I had made my prior map based off guesswork. Also, how many counties does Bush win here?
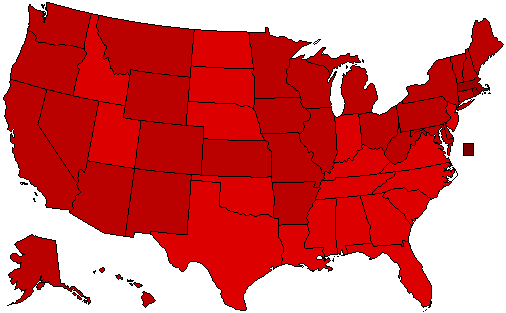
Roughly 354. On par with the number of counties that Herbert Hoover won in 1932 and over 200 more than McGovern won in 1972.Very good job! I will go back and revise what I've done to reflect this. My intention was for this kind of scenario; I had made my prior map based off guesswork. Also, how many counties does Bush win here?
That's amazing. I think this scenario helps to show you the areas where each candidate was strongest in 1992. Perot seems to have been strongest in rural counties out West (+Maine); Clinton, in rural counties throughout the Midwest and Upper South, as well as in the Northeast. It also shows how much less polarized the country still was at that time. Bush also wins only about twenty or so more counties than Hoover did in 1932 or Walter Mondale did in 1984. I would reckon that if Bill's wife had won by this margin in 2016, she might have been lucky to break the 1000 mark in terms of counties carried.Roughly 354. On par with the number of counties that Herbert Hoover won in 1932 and over 200 more than McGovern won in 1972.
What do you mean?Jeb Bush unfortunately does not win any counties.
Threadmarks
View all 43 threadmarks
Reader mode
Reader mode
Recent threadmarks
Pericles-Obama landslide in 2008 Pericles-Obama does better in 2012 Tex Arkana-Carter runs a better campaign in 1976 and picks Frank Church as his running mate, winning in a landslide. DPKdebator-Trump landslide in 2016 wildviper121-Trump landslide based off of someone's Campaign trail game DPKdebator-The worst you can do as Hillary Clinton in the campaign trail game TheSaint1950-Last gallup poll in 1948 is right jonnguy2016-Trump self-sabotage- Status
- Not open for further replies.
Share: