Alternate Electoral Maps

Status
Not open for further replies.
1996 if Pat Buchanan had run as a third party (Ross Perot still runs and does about as well as he did IOTL)

genusmap.php


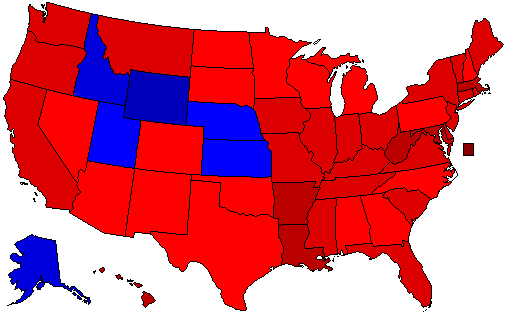
Buchanan wins 7-8% of the popular vote and throws the entire South to Clinton. note that I believe this would likely be the map if Buchanan had won the GOP nomination as well.

Pat Buchanan did threaten to run Third Party if Dole picked a pro-choice running mate IIRC.
 
Pat Buchanan did threaten to run Third Party if Dole picked a pro-choice running mate IIRC.

If Buchanan had actually ran third party, I'd be curious as to whether Ross Perot would have still ran as well. because if he didn't, I could see the map being even worse for Dole (with Alaska and possibly Idaho flipping)
 

Rhad

Banned
If we assume that Buchanan gets half of his primary percent in every state, he'd get 10.4% of the vote. Clinton would win 44 states (everything except Alaska, Wyoming, Idaho, Kansas, Nebraska, and Utah). He'd get 512 electoral votes, and a 18.9% margin in the popular vote.
 
If we assume that Buchanan gets half of his primary percent in every state, he'd get 10.4% of the vote. Clinton would win 44 states (everything except Alaska, Wyoming, Idaho, Kansas, Nebraska, and Utah). He'd get 512 electoral votes, and a 18.9% margin in the popular vote.

If he's getting 10.4% nationally, he'd surely get more than that in Alaska and he would probably get enough there for Clinton to eek out a narrow plurality win.
 
Using a generic uniform swing, that would be Trump -3, Clinton -8, and Johnson +13 (McMullin +13 in Utah to make things more (less?) interesting), resulting in an overall 5-point swing toward Trump.
genusmap.php

337 for Trump, 201 for Clinton.
Note: While New Mexico is shaded as Clinton winning with less than 40%, she did get 40%, but I wanted to add variety to the map. Trump gets 42% in Utah, but again, I shaded it with him winning with less than 40% to add some variety to the map.

Considering uniform swing is generally BS, it would probably look a lot different.
 
^ On a sidenote, from the look of it, the only county McMullin gets by going up 13 and Trump going down 3 is Cache. Clinton wins Salt Lake and Trump wins Grand County with 33.5% and 39.9% respectively.
 
2020

genusmap.php

(Basically a much better attempt than my previous 2020 scenario. Hopefully now I can start a future TL here.)


President Trump goes to war with North Korea to raise his approval ratings, but a recession worse than 2008 hits and Trump's approval ratings fall to 35%. Biden is pretty much unopposed during the Democratic primaries.

VP Joe Biden (D-DE)/State Sec. Jason Kander - 391 EV, 51.6%
Pres. Donald Trump (R-NY)/VP Mike Pence (R-IN) - 147 EV, 43.8%
Mayor Bob Stephens (L-MO)/Larry Sharpe (L-NY) - 0 EV, 3.8%
 
Last edited:
2020

genusmap.php

(Basically a much better attempt than my previous 2020 scenario. Hopefully now I can start a future TL here.)


President Trump goes to war with North Korea to raise his approval ratings, but a recession worse than 2008 hits and Trump's approval ratings fall to 35%. Biden is pretty much unopposed during the Democratic primaries.

VP Joe Biden (D-DE)/Sec. Jason Kander - 391 EV, 51.6%
Pres. Donald Trump (R-NY)/VP Mike Pence (R-IN) - 147 EV, 43.8%
Mayor Bob Stephens (L-MO)/Larry Sharpe (L-NY) - 0 EV, 3.8%

tumblr_n37ysfSHPW1rf7o2uo1_500.gif
 
0zQhOAw.png

Parliamentary-style election map for a timeline in which American rebels and the British crown are able to come to a compromise on American independence in the early 19th century, bringing the U.S. to adopt a U.K.-esque representational govt. (Canada Style).
 
0zQhOAw.png

Parliamentary-style election map for a timeline in which American rebels and the British crown are able to come to a compromise on American independence in the early 19th century, bringing the U.S. to adopt a U.K.-esque representational govt. (Canada Style).
Just noticed something.

American Left are the leftmost of America!!!
 
2020

genusmap.php

(Basically a much better attempt than my previous 2020 scenario. Hopefully now I can start a future TL here.)


President Trump goes to war with North Korea to raise his approval ratings, but a recession worse than 2008 hits and Trump's approval ratings fall to 35%. Biden is pretty much unopposed during the Democratic primaries.

VP Joe Biden (D-DE)/Sec. Jason Kander - 391 EV, 51.6%
Pres. Donald Trump (R-NY)/VP Mike Pence (R-IN) - 147 EV, 43.8%
Mayor Bob Stephens (L-MO)/Larry Sharpe (L-NY) - 0 EV, 3.8%

Give Biden Texas and I feel this would be a realistic map.
 
2020

genusmap.php

(Basically a much better attempt than my previous 2020 scenario. Hopefully now I can start a future TL here.)


President Trump goes to war with North Korea to raise his approval ratings, but a recession worse than 2008 hits and Trump's approval ratings fall to 35%. Biden is pretty much unopposed during the Democratic primaries.

VP Joe Biden (D-DE)/Sec. Jason Kander - 391 EV, 51.6%
Pres. Donald Trump (R-NY)/VP Mike Pence (R-IN) - 147 EV, 43.8%
Mayor Bob Stephens (L-MO)/Larry Sharpe (L-NY) - 0 EV, 3.8%

Nice map! One critique, though; this might be just a tad more realistic if the head Democratic ticket was replaced by somebody like Kirsten Gillibrand or Tammy Baldwin, TBH-I really do like Biden but he'd be 77 in 2020 and we're not sure if he'll actually live that long. I'd also add that any third party ticket would likely get quite a bit more than 3.8% of the vote.....
 
Parliamentary-style election map for a timeline in which American rebels and the British crown are able to come to a compromise on American independence in the early 19th century, bringing the U.S. to adopt a U.K.-esque representational govt. (Canada Style).
Interesting. What are the parties like, and can you give us the names of their leaders and important MPs?
 
Top
Status
Not open for further replies.
Top