The electoral constituencies of the alt-election of 1991 in Yugoslavia
*squeeing*
No, seriously, this is a beaut
The electoral constituencies of the alt-election of 1991 in Yugoslavia
Here are some battleground state polls from 2000 (ignore RCP's blatant Republican bias)
Some of these polls are crazy by todays' standards.

WV was fairly Democratic pre-2000, though
I don’t see a reason why it wouldn’t vote Dem in 2000 if the ticket was right
If it was 2012, then there’d be more reason to complain

RCP were (are?) Republican hacks. They consistently added like 8 points to Bush's totals.Did Gore really do so poorly in that debate?
I mean, they apparently thought California and Illinois were Lean R
I think West Virginia could have conceivably gone Democratic in 2012, if John Edwards had been the D nominee in 2008 and his little scandal somehow never came out, and he was a popular incumbent by 2012.
What would the electoral map look like here?
Why flip Nevada instead of Iowa?View attachment 439075
Kerry wins in 2004 with a shift of roughly 160 thousand votes in Nevada, New Mexico, and Ohio. ITTL he loses the popular vote but wins in EC.
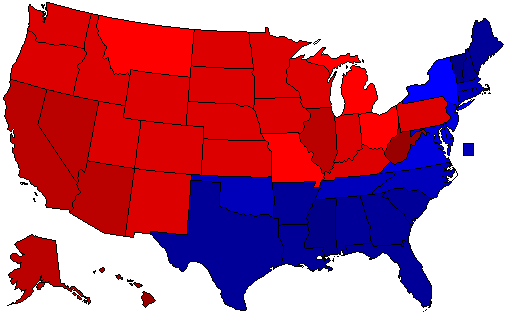
This is from an alternate timeline I imagined up. can you guess what causes this?
No, blue is GOP.The last breath of the new deala
The Gods of the Atlantic really like the Republicans and exert their influence on all states that touch her waters?
This is from an alternate timeline I imagined up. can you guess what causes this?


From the looks of it, I am assuming an alternate reality in which Reconstruction is successful, with black voters delivering the South to the Republicans, and New England remaining steadfastly in their camp? At the same time, I would guess that Democrats become the Party of Bryan, fixing themselves in Appalachia, the Midwest, and West.
This is from an alternate timeline I imagined up. can you guess what causes this?
2016 general election in the Federal Republic of Upper Pacifica
Some kind of alternate 1976?
This is from an alternate timeline I imagined up. can you guess what causes this?
