Alternate Electoral Maps II

Status
Not open for further replies.
In the meantime, here's another random map. I mapped out a result from the Campaign Trail Hall of Fame, showing Charles Evan Hughes defeating Woodrow Wilson in a landslide in 1916:

genusmap.php

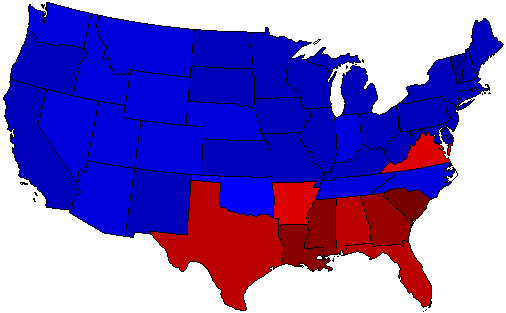
Charles Evans Hughes (R-New York)/Charles Fairbanks (R-Indiana)-429 EV-60.83%
Woodrow Wilson (D-New Jersey)/Thomas Marshall (D-Indiana)-102 EV-35.62%
Others-0 EV-3.55%
 
I have a question for you as well. I've been thinking about posting another scenario, of the 2016 election if Clinton had won with the exact same percentage, and by the exact same margin, as Lyndon Johnson in 1964 (61.05-38.47%). Similarly, I was also thinking about posting one if Trump had won by the exact same margin, and with the exact same percentage, as Richard Nixon in 1972 (60.67-37.52%). In both instances, I would like to perform a uniform swing for every state, to make them accord with those results. Would you happen to know how to do so?
I am not sure honestly. I don’t know too much about those aspects of map-making.
 
More Google Trends, this time with the four Walt Disney World parks over the last 12 months

genusmap.php

Epcot - 237 EV
Animal Kingdom - 222 EV
Magic Kingdom - 79 EV
Hollywood Studios - 0 EV
 
I have a question for you. Are you still working on the 1992 county map for Bush + Perot?
I actually forgot about that months ago, but I can start working on it now.

I have a question for you as well. I've been thinking about posting another scenario, of the 2016 election if Clinton had won with the exact same percentage, and by the exact same margin, as Lyndon Johnson in 1964 (61.05-38.47%). Similarly, I was also thinking about posting one if Trump had won by the exact same margin, and with the exact same percentage, as Richard Nixon in 1972 (60.67-37.52%). In both instances, I would like to perform a uniform swing for every state, to make them accord with those results. Would you happen to know how to do so?
You just take the margin and split it in half, so if you want to add 20% to a candidate, give one candidate 10% and take 10% from another.
 
I actually forgot about that months ago, but I can start working on it now.


You just take the margin and split it in half, so if you want to add 20% to a candidate, give one candidate 10% and take 10% from another.
So, let's take an example. Clinton won California 61.48-31.49% in 2016. If I wanted to increase her national percentage from 48.02% to 68.02%, with a universal swing across all states, I would add 10% to her total in California (giving her 71.48%) and take 10% away from Trump's (giving him 21.49%). Is that correct? Or if not, could you give me another example?
 
Here's another map. It's not exactly what @MorganKingsley was asking about earlier, but it's close enough. A while back, @DPKdebator had posted his own version of what 2016 would have looked like with 1936 and 1972 PV margins. On a Discord feed for Atlas users, @Reagent did uniform swing calculations for the 2012 and 2016 elections, including one for 2016, if Trump had won with the exact same percentage (60.67%) and by the exact same margin (23.15%) as Nixon in 1972. And here is the map for that:

genusmap.php

Donald Trump (R-New York)/Mike Pence (R-Indiana)-535 EV-60.67%
Hillary Clinton (D-New York)/Tim Kaine (D-Virginia)-3 EV-37.52%
Others-0 EV-1.81%
Some interesting, and alarming (for some) figures, from this scenario:
  • Trump breaks 60% in 25 states, including the swing or competitive states of Arizona, Colorado, Florida, Georgia, Maine, Minnesota, New Hampshire, North Carolina, and Nevada, as well as in every Midwestern state he won in OTL, and in states such as Indiana, Missouri, and Montana (all three of which he won by ~19% in OTL), and in Texas.
  • Trump breaks 70% in 11 states, including in every state where he won over 60% in OTL, and in Idaho and Nebraska, which he carried with around 59% (Idaho was below the 60% mark because of McMullin). He gets 77.89% of the vote in West Virginia and 79.51% in Wyoming, his two best states.
  • Clinton wins the District of Columbia (of course), her only victory in the entire country, but with only 69.74% of the vote. Trump approaches the 30% mark. She loses Vermont by ~6 points, Massachusetts and Maryland by ~4 points each, California by ~3 points, and Hawaii by less than a point. Trump wins his home state of New York by ~8 points. He earns 60.27% in Kaine's home state of Virginia and 69.39% in Pence's home state of Indiana.
Again, such a scenario would have been implausible in OTL, but it is still astonishing to know what the results would have been with a national swing.
 
So there’s this neat little computer game from the late 80’s called President Elect. It’s an election simulator and it can simulate a wide range of scenarios. For example, I simulated a hypothetical matchup between Jimmy Carter and Ronald Reagan in 1976, and the results were fairly interesting...

1976

genusmap.php

Gov. Jimmy Carter (D-GA)/Sen. Fritz Mondale (D-MN) - 271 EV, 41,631,528, 50% PV
Fmr. Gov. Ronald Reagan (R-CA)/Gov. Jim Rhodes (R-OH) - 267 EV, 41,911,080, 50% PV

Carter just barely manages to win the electoral vote, but still loses the popular vote to Reagan. Several states (WI, MI, LA, FL) are won by razor thin margins (ranging from 6,000 to 3,000 votes) but out of them Hawaii is the closest. Carter wins that state by only 953 votes! This means that a swing of only 477 votes to Reagan wins him the election!

1976

genusmap.php

Fmr. Gov. Ronald Reagan (R-CA)/Gov. Jim Rhodes (D-OH) - 271 EV, 41,911,557, 50% PV
Gov. Jimmy Carter (D-GA)/Sen. Fritz Mondale (D-MN) - 267 EV, 41,631,051, 50% PV

Results are sometimes wonky however. Reagan losing Virginia to Carter is one example. If you want a better example of a wonky election, look at this matchup between Robert Kennedy, Richard Nixon, and George Wallace in 1968:

1968

genusmap.php

Sen. Robert F. Kennedy (D-NY)/Sen. Ralph Yarborough (D-TX) - 325 EV, 31,968,028, 48% PV
Fmr. Vice Pres. Richard M. Nixon (R-CA)/Gov. Spiro Agnew (R-MD) - 203 EV, 29,997,624, 45% PV
Fmr. Gov. George C. Wallace (AI-AL)/Ret. Gen. Curtis LeMay (AI-CA) - 10 EV, 4,743,009, 7% PV

Seems strange to me that Bobby Kennedy would manage to win several states in the Deep South while losing states like Illinois and Wisconsin. But who knows, many Wallace voters did start out supporting Kennedy so maybe that, along with vote splitting between Nixon and Wallace, would deliver the election to him.
 
Last edited:
genusmap.php


Wallace wins every state he finishes second in. Only one elector is needed to go rogue against nixon to throw the election. Had Humphrey won Missouri or Wallace Florida, it would have been sealed away for Wallace to throw it to the house
 
I promise this will be the last map of the day.

genusmap.php


A LaFollette style third party candidate runs and wins every state he got second or first place in the 2016 election. Trump wins by the skin of his teeth

Despite his extremely narrow victory electorally, he decimates both of his opponents, getting nearly twice of their individual electoral votes. He probably wins the popular vote by at least 10 points, maybe even closer to 15 or 20. This would be a landslide
 
So, let's take an example. Clinton won California 61.48-31.49% in 2016. If I wanted to increase her national percentage from 48.02% to 68.02%, with a universal swing across all states, I would add 10% to her total in California (giving her 71.48%) and take 10% away from Trump's (giving him 21.49%). Is that correct? Or if not, could you give me another example?
In that scenario, you would take 20% from Trump and add 20% to Clinton.
 
Does anyone know if there is an easy access for determining the number of slaves vs non slaves in each of the censuses up to 1860? I'm trying to look to see what elections would be altered based on other fractions than 3/5. For example, if slaves were fully counted, then Jefferson would have beat Adams in 1796.
 
Status
Not open for further replies.
Top