Apparently Connelly had sympathies for Nixon at the time so he probably wouldn’t accept it. Also since Kennedy is a Gov. here he would probably want a senator running mate.If anything John Connally would be a compromise
You are using an out of date browser. It may not display this or other websites correctly.
You should upgrade or use an alternative browser.
You should upgrade or use an alternative browser.
Alternate Electoral Maps II
- Thread starter Aaaaasima
- Start date
- Status
- Not open for further replies.
Threadmarks
View all 43 threadmarks
Reader mode
Reader mode
Recent threadmarks
Pericles-Obama landslide in 2008 Pericles-Obama does better in 2012 Tex Arkana-Carter runs a better campaign in 1976 and picks Frank Church as his running mate, winning in a landslide. DPKdebator-Trump landslide in 2016 wildviper121-Trump landslide based off of someone's Campaign trail game DPKdebator-The worst you can do as Hillary Clinton in the campaign trail game TheSaint1950-Last gallup poll in 1948 is right jonnguy2016-Trump self-sabotageMade a just-for-fun map of what the next PEI provincial election might look like based on current polls, since it's the election I'm anticipating most for next year. I basically just eyeballed what the swing in each riding could theoretically be if the swing was mostly uniform across the province (with the Greens performing slightly better in Charlottetown than elsewhere). I also bumped up the turnout by a couple hundred in each riding due to the rise of the Greens and the concurrent referendum on electoral reform that will be taking place simultaneously. I expected to have to alter my eyeballed results after tallying up the vote percentages across the province, but they ended up being fairly in line with the latest polls; by happenstance, the Greens ended up being only one vote behind the Liberals.
(To make the map, I definitely just ripped DrRandomFactor's 2015 map from Wikipedia and painted over it.)


(To make the map, I definitely just ripped DrRandomFactor's 2015 map from Wikipedia and painted over it.)
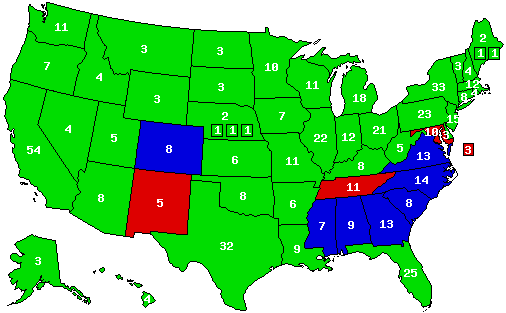
2000 if Nader won his home state of Connecticut

George Bush - 335 electoral votes / 39.87 percent popular vote
Ralph Nader - 200 electoral votes / 35.74 percent popular vote
Al Gore - 3 electoral votes / 23.38 percent popular vote
George Bush - 335 electoral votes / 39.87 percent popular vote
Ralph Nader - 200 electoral votes / 35.74 percent popular vote
Al Gore - 3 electoral votes / 23.38 percent popular vote
1996 if Perot had won his home state of Texas
Ross Perot - 437 electoral votes / 48.4 percent popular vote
Robert Dole - 71 electoral votes / 20.7 percent popular vote
Bill Clinton - 29 electoral votes / 29.2 percent popular vote
Ross Perot - 437 electoral votes / 48.4 percent popular vote
Robert Dole - 71 electoral votes / 20.7 percent popular vote
Bill Clinton - 29 electoral votes / 29.2 percent popular vote
U.S. with Canadian parties:

American politics has typically been dominated by two parties, the Conservatives and Labor. Traditionally, the Conservatives were the party of white-collar businessmen, while Labor was branded the party of the working man. The Deep South and the West are the cores of the Conservative Party, while the Midwest and Appalachia are the traditional cores of the Labor Party. The parties have straddled between center and center-left (for Labor) / center-right (for Conservatives) depending on the party leadership. This two-party system has been usurped by the recent rise of the left-wing New Democratic Party, which has taken hold of urban centers especially in the Northeast and West Coast. The separatist, big-tent Texas Group was once a dominant force in Texas politics, but has lost a lot of influence over the past decade and the Conservatives have emerged as the predominant force in Texas. The Greens can only be found in the most left-wing parts of the country, occasionally proving competitive in races in San Francisco, parts of the Boston area, and Burlington, Vermont.
Wouldn’t you need a Bloc Québécois in like the South West ?
What about Utah and the surrounding areas? Or perhaps the Pacific Northwest?Wouldn’t you need a Bloc Québécois in like the South West ?
The Texas Group is a stand-in for the Bloc Quebecois. Just like how the Bloc Quebecois is not as widespread as it was 10-15 years ago, the Texas Group is no longer a dominant force in Texan politics.Wouldn’t you need a Bloc Québécois in like the South West ?
I'd say secessionists in that area are mere fringe groups (to a greater extent than Texas).What about Utah and the surrounding areas? Or perhaps the Pacific Northwest?
I just thought it would be a Confederate Block in the Deep South...The Texas Group is a stand-in for the Bloc Quebecois. Just like how the Bloc Quebecois is not as widespread as it was 10-15 years ago, the Texas Group is no longer a dominant force in Texan politics.
I'd say secessionists in that area are mere fringe groups (to a greater extent than Texas).
I just thought it would be a Confederate Block in the Deep South...
But that’s not really analogous to bloc with is all about a separate spoken language ( French) an Aztlan party would make sense.
But that’s not really analogous to bloc with is all about a separate spoken language ( French) an Aztlan party would make sense.
Sepratist New Mexico would be a good choice then?
Unfortunately, New Mexico is small enough that a secessionist party would be ignored. There are only 4 states in the US that I can imagine (with a post-1900 POD) having a real movement: Texas, California, Alaska and Hawaii.Sepratist New Mexico would be a good choice then?
POD: Steve Forbes winning early victories causes Bush's machine to become reckless meaning he goes too far dogwhistling against McCain in NH causing him to lose. He drops out after McCain scores more victories. After that Keyes picks up the conservative banner...
McCain beats Bush in Texas? how?!
He'd dropped out by then.
And if McCain offers Keyes the VP spot, I might just've found the sucessor to AWOL, AWOT and FLaG.
1992 if Perot won his home state of Texas
Ross Perot - 348 electoral votes / 38.7 percent popular vote
Bill Clinton - 139 electoral votes / 33.0 percent popular vote
George Bush - 51 electoral votes / 27.5 percent popular vote
Ross Perot - 348 electoral votes / 38.7 percent popular vote
Bill Clinton - 139 electoral votes / 33.0 percent popular vote
George Bush - 51 electoral votes / 27.5 percent popular vote
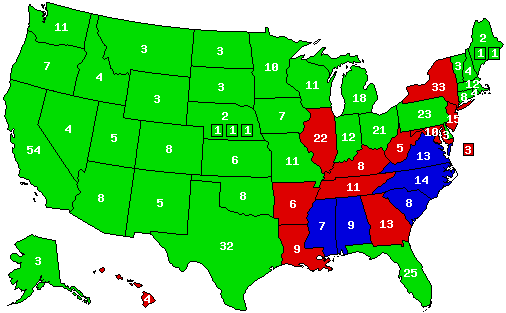
This is another Democratic landslide, this one based on the 2000 Presidential Election. I like this map in particular because Gore does well in both rural and suburban/urban areas, providing a nice buffer between the better rural Democratic performances of the 80s and 90s and the more suburban/urban coalitions of the later 2000s.
And this is McCain/[REDACTED] (290)vs Gore/Lieberman (247) 2000.
What states would Gore win here?This is another Democratic landslide, this one based on the 2000 Presidential Election. I like this map in particular because Gore does well in both rural and suburban/urban areas, providing a nice buffer between the better rural Democratic performances of the 80s and 90s and the more suburban/urban coalitions of the later 2000s.
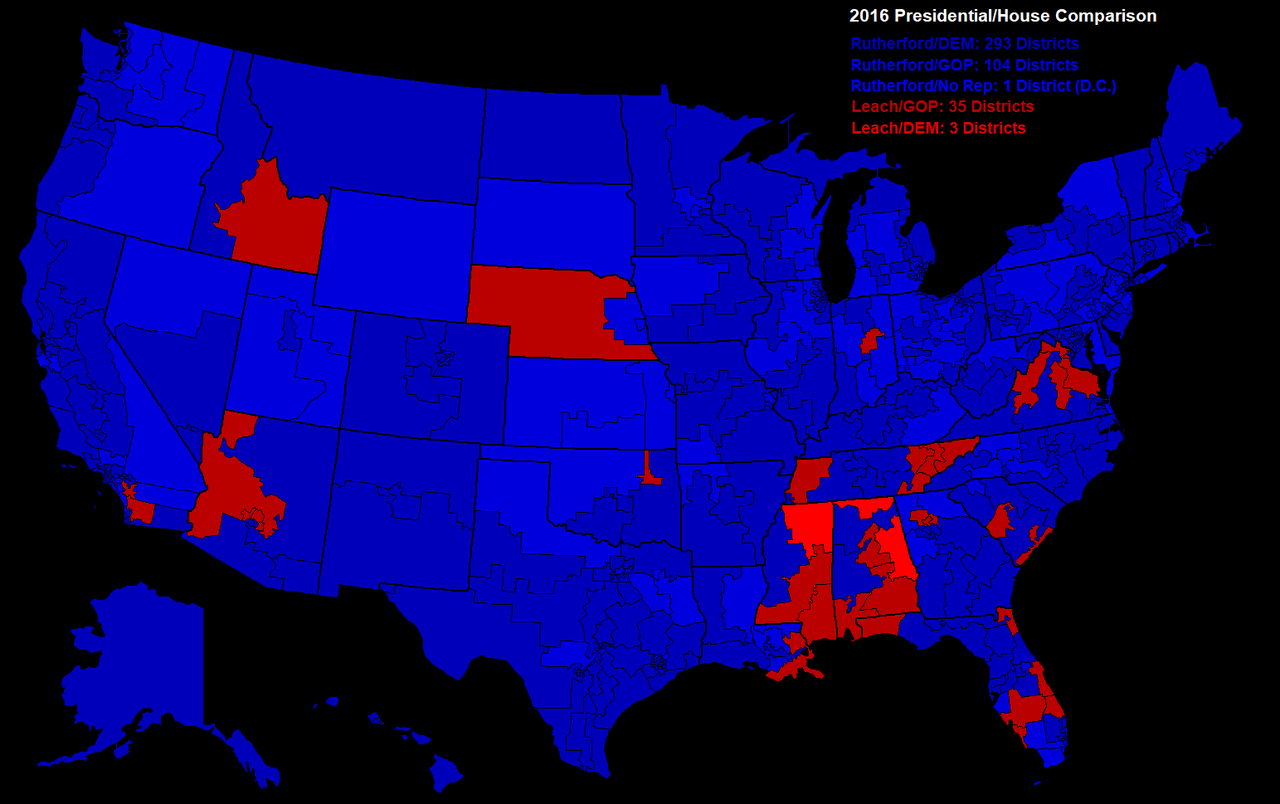
Here's a map for the New Rutherford Scenario that I haven't posted here: the map of the presidential results by congressional district, compared with the congressional results in those districts. Dark blue districts are districts won by both President Rutherford and a Democratic congressional candidate (both incumbents and non-incumbents). Light blue districts are districts won by President Rutherford and a Republican congressional candidate (both incumbents and non-incumbents). Dark red districts are districts won by both Senator Leach and a Republican congressional candidate (both incumbents and non-incumbents). Light red districts are districts won by Senator Leach and a Democratic congressional candidate (both incumbents and non-incumbents). All total, President Rutherford wins 281 of the 284 Democratic districts and 113 of the 151 Republican districts; Senator Leach carries 3 Democratic districts and 38 Republican districts.
Last edited:
Threadmarks
View all 43 threadmarks
Reader mode
Reader mode
Recent threadmarks
Pericles-Obama landslide in 2008 Pericles-Obama does better in 2012 Tex Arkana-Carter runs a better campaign in 1976 and picks Frank Church as his running mate, winning in a landslide. DPKdebator-Trump landslide in 2016 wildviper121-Trump landslide based off of someone's Campaign trail game DPKdebator-The worst you can do as Hillary Clinton in the campaign trail game TheSaint1950-Last gallup poll in 1948 is right jonnguy2016-Trump self-sabotage- Status
- Not open for further replies.
Share: