Alternate Electoral Maps II

Status
Not open for further replies.
And the county map (Obama would have been the first Democrat since Carter in '76 to win a majority of counties)

uABDYlU.jpg

There are a few more revisions which I'm going to make to my Rutherford scenario. I'm going to add additional counties in Indiana, Colorado, and a few other states to better reflect the results. So I was wondering: what is Obama's winning margin in Indiana in this map?
 
Something from A House Divided. The year, since I noticed it doesn't show on the map, is 1849.

And something I've wanted to do for some time: an election map! That is, one slightly more detailed than what we've seen for the US presidential elections.

nos-val-eng-1849-png.348343
 
Last edited:
There are a few more revisions which I'm going to make to my Rutherford scenario. I'm going to add additional counties in Indiana, Colorado, and a few other states to better reflect the results. So I was wondering: what is Obama's winning margin in Indiana in this map?

He wins Indiana by about 20% here.
 
Could anyone try to make my Nixon vs Wallace (Wallace victory) county map into a shaded one like the official ones you see on Wikipedia? I can provide the margins for each state if you need them, and I don't mind waiting. I think it'd be really visually interesting.
 
He wins Indiana by about 20% here.
I see. Are Tennessee and Kentucky within single digits? What about West Virginia? I am interested in increasing the number of Democratic counties in those states while maintaining the same margins as before. I would think that 2008 would be a good baseline map to use.
 
I see. Are Tennessee and Kentucky within single digits? What about West Virginia? I am interested in increasing the number of Democratic counties in those states while maintaining the same margins as before. I would think that 2008 would be a good baseline map to use.
Yes, he wins Tennessee and Kentucky by single-digit margins.
 
No Electoral College: Election of 1992

Screen Shot 2017-10-09 at 5.19.12 PM.png

President George H. W. Bush of Texas began his re-election campaign as one of the most popular presidents of the modern era. The country praised the United States's victory in the Gulf War, and many believed Bush was responsible. However, as the economy began to head in a downward spiral, his approval ratings fell dramatically. Governor Bill Clinton of Arkansas had taken the Democratic Party by storm, defeating Democratic "Favorite Sons" that were expected to win the nomination. He campaigned on a message of bringing a new era of fiscal responsibility and progressive ideals to America, which appealed to many voters. Businessman Ross Perot of Texas, however, was the real story. He rose dramatically in the polls, campaigning against North American Free Trade Agreement, which included Canada and Mexico, as being disadvantageous to Americans. He railed against the corruption in Washington and sought to have an administration dedicated to economic policies of prosperity on all levels, from fair trade to lower taxes. However, after months of being in the spotlight, his standing in the polls fell, and he remained stationary in third place.

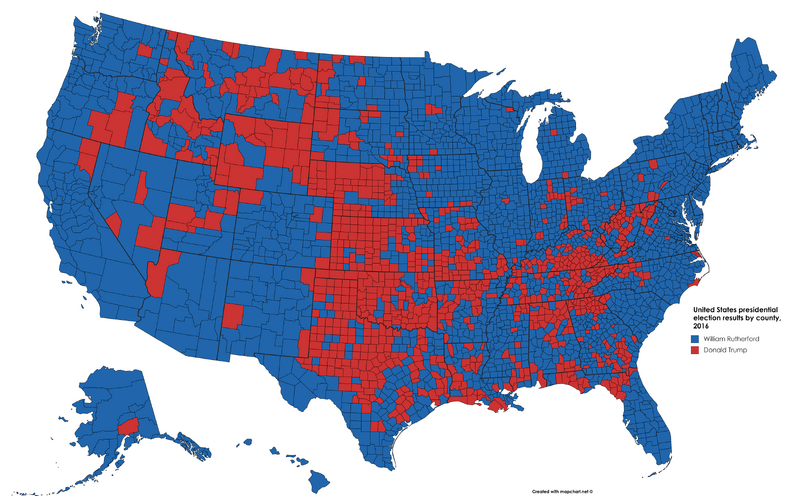
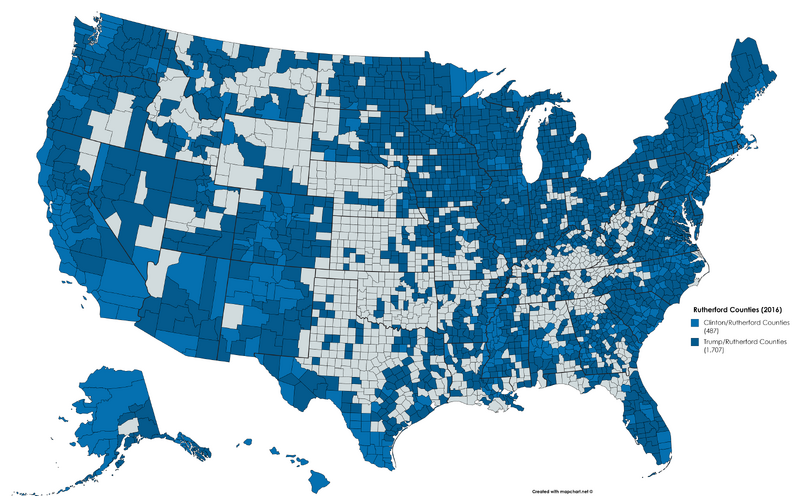
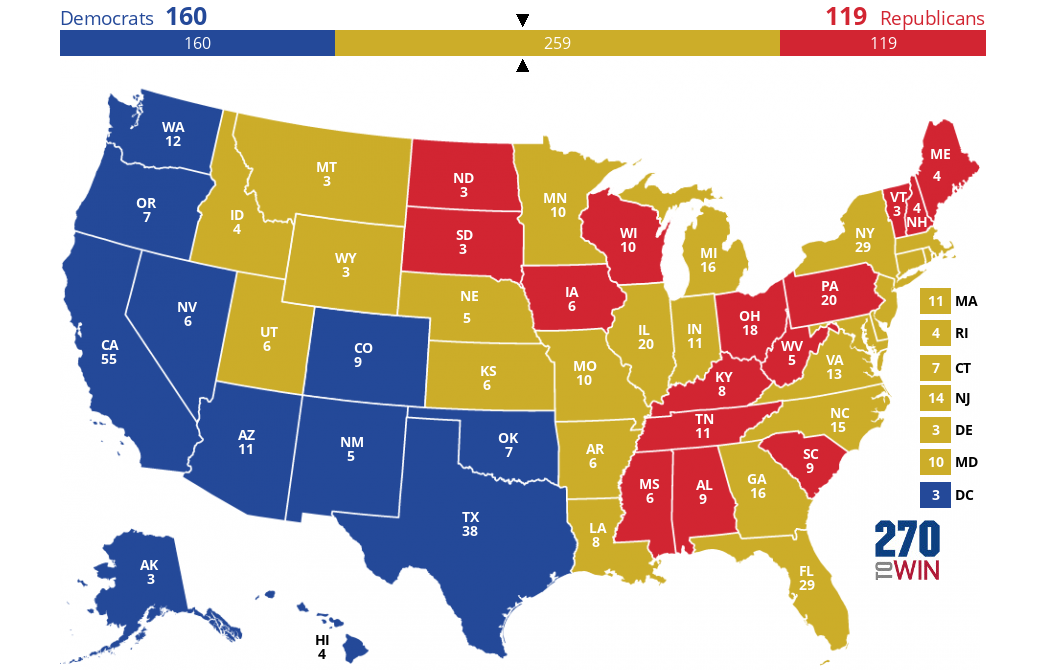
On Election Day, as many pundits predicted, no one won a majority of the votes. President Bush outperformed (despite still losing), carrying crucial states like Ohio and Florida. Governor Clinton carried his home state of Arkansas, as well as other increasingly Republican-leaning states like Louisiana and Montana. In addition, he ended the Republican Party's dominance in New England states like Maine and Vermont, with Bush carrying only New Hampshire. Ross Perot over performed as well, winning more than 20% of the popular vote and carrying Maine. Exit polls showed that Republicans and Democrats voted for him at about equal levels, with Democratic blue-collar voters (especially in the South and Midwest) siding with him more than the Republicans. Many analysts have determined that the prevalence of Democratic-leaning blue-collar Perot voters explains why President Bush was able to carry states in the South and Midwest that some expected him to lose, namely Ohio.

Screen Shot 2017-10-09 at 5.20.00 PM.png

In the second round, President Bush was able to win back voters in the South and the West but was unable to make necessary gains throughout the Midwest and New England. Voters that voted for Ross Perot largely ended up voting for the parties that they had voted for before, with blue-collar workers and middle-class conservatives begrudgingly voting for Bill Clinton and George H W. Bush, respectively. After twelve years of Republican dominance, the White House was once again returned to the Democrats.

First Round:

Governor Bill Clinton: 40.5%

President George H. W. Bush: 38.1%
Businessman Ross Perot: 20.7%

Second Round:

Governor Bill Clinton: 55.6%

President George H. W. Bush: 44.4%
 
Last edited:
Yes, he wins Tennessee and Kentucky by single-digit margins.
I asked because I think those would be plausible maps for Kentucky and Tennessee, while both states are still within 5-6 points. As for West Virginia, I'm going to try to rig a map of the state from 2000, when Bush won it by four points, to make it a 1.5% Democratic victory. As for Indiana, I kept fifteen counties, including the most Republican ones, Republican, using a map from 2000 (with alterations), and for Missouri, I used your map of Obama's victory there, considering that the Democratic margin of victory is slightly larger than McCaskill's from 2012, which I used previously, and that it would be plausible. For Colorado, I am giving two more counties to the Democrats. I'm also altering Virginia, making it more reflect Mark Warner's map from 2008 while still keeping some counties in Appalachia Republican. Are all of these changes reasonable?
 
I asked because I think those would be plausible maps for Kentucky and Tennessee, while both states are still within 5-6 points. As for West Virginia, I'm going to try to rig a map of the state from 2000, when Bush won it by four points, to make it a 1.5% Democratic victory. As for Indiana, I kept fifteen counties, including the most Republican ones, Republican, using a map from 2000 (with alterations), and for Missouri, I used your map of Obama's victory there, considering that the Democratic margin of victory is slightly larger than McCaskill's from 2012, which I used previously, and that it would be plausible. For Colorado, I am giving two more counties to the Democrats. I'm also altering Virginia, making it more reflect Mark Warner's map from 2008 while still keeping some counties in Appalachia Republican. Are all of these changes reasonable?

I believe so.
 
Alternate 2016-Democrat win
2016 presidential election
genusmap.php

Hillary Clinton/Tim Kaine-Democratic: 334 EV 50.02%
Donald Trump/Mike Pence-Republican: 204 EV 43.93%

2016 Senate elections
Harry Reid-Democratic: 49+5 55.8%
Mitch McConnell-Republican: 49-5 40.4%
Independent: 2_
100 seats
51 for majority
upload_2017-10-10_15-9-46.png

2016 House elections

Paul Ryan-Republican: 236-11 47.1%
Nancy Pelosi-Democratic: 199+11 50.0%
435 seats
218 for majority
upload_2017-10-10_15-32-34.png

2016 gubernatorial elections
Susana Martinez-Republican: 31_ 47.50%
Dan Malloy-Democratic: 18_ 49.46%
upload_2017-10-10_15-16-22.png

 
I believe so.
And here is the updated map. I also added counties in Texas and North Dakota to the Democratic total, using Bill Clinton's 1996 map and a Democratic gubernatorial map from the 80s as references, besides adding a county in Nebraska to make it somewhat closer to how it looked in 1964. Counties were also added in Ohio and Virginia. By my new calculation, Rutherford has a final, grand total of 2,194 counties to Trump's 919.

 
Last edited:
If the states voted purely based on their average median household purchasing power (data from here)
Democratic (below avg. median household purchasing power) - 267 EVs
strongest states - Hawaii, New York, Maine
Republican (above avg. MHPP) - 271 EVs
strongest states - Minnesota, Utah, Iowa
closest states - Massachussets, Oregon, Idaho, Georgia, Delaware

genusmap.php


This is a very aesthetically pleasing map.
 
2008 if the results were a uniform national swing from 2004. Obama wins Arkansas and Missouri but loses Indiana and North Carolina compared to OTL, otherwise the state results are the same. the really interesting differences are at the county level, with Obama doing much better in Appalachia and most of the South but worse most everywhere else.

Dkit6tw.jpg
 
A revised version of the Rutherford Counties map, taking into account the adjustments made above. Rutherford wins 2,194 counties (70.47%) to Trump's 919 (29.53%). This is far better than 2016, when Trump won 2,626 counties (84.35%) to Clinton's 487 (15.65%). In this scenario, Rutherford wins all of Clinton's counties, and 1,707 of Trump's:

 
Last edited:
Carter wins 271 to 267 I feel like if he still barely loses the popular vote a la 2000 they'll abolish the EC by at lest the 1990's.

In 1980 numbers, Carter wins the Electoral College 284-254. Still, this is a very weak victory for an incumbent President and he probably loses the popular vote by more than 1%. I also don't think he comes all that close to winning a majority of counties, in spite of his (relatively) great appeal in the rural South.
 
Status
Not open for further replies.
Top