Alternate Electoral Maps II

Status
Not open for further replies.
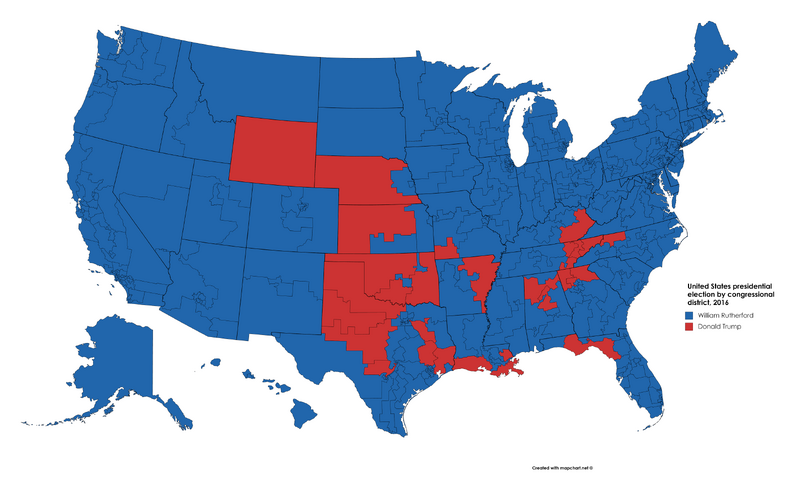
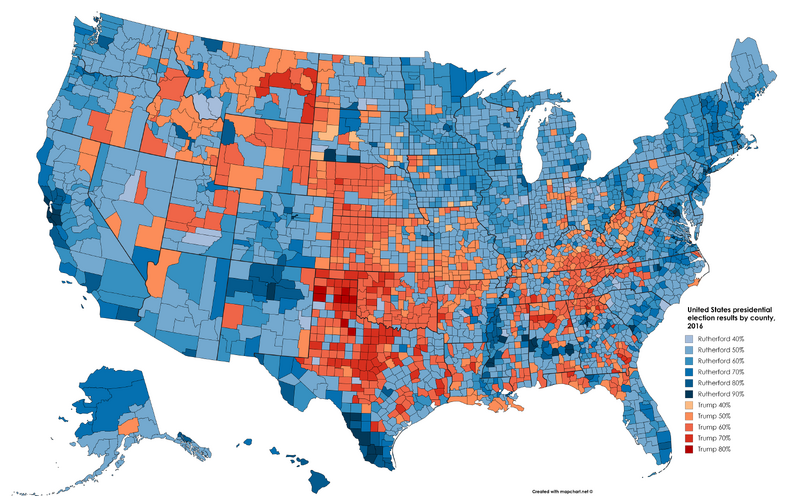
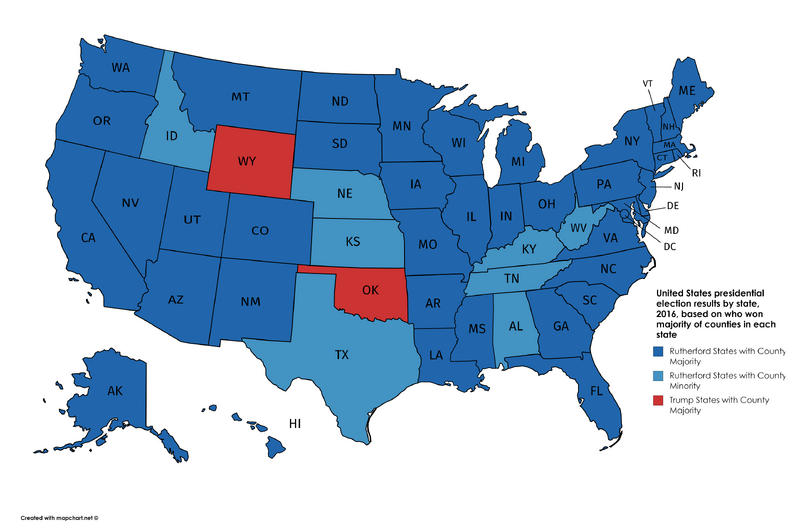
Another interesting map which I have devised for my Rutherford scenario. This map depicts the 2016 election by state, based upon who carried the majority of counties in that state. Blue states are states won by Rutherford where he also won a majority of the counties. Light blue states are states won by Rutherford, but ones where Trump carried more counties. And red states, of course, are ones that Trump won and carried a majority of counties in. Overall, Rutherford won 2,034 counties (65% of the total), and Trump won 1,110 counties (35% of the total), which almost exactly matches up with the popular vote. Note, however, that in red states, where Clinton and Obama were restricted to mere handfuls of counties (i.e. Texas, North Carolina, Georgia, Louisiana, Alabama, Arkansas, etc.) Rutherford does significantly better. Especially in Texas.

800
 
Last edited:
Rutherford likely wins the White vote in every state except for the Deep South, North Carolina, Wyoming, Oklahoma, and Texas.
I made some more recent, rough calculations, relating to this as well. If my calculations are correct, Trump carries the white vote in all of the states you mentioned. Whites would be over 40% Republican in Ohio and Indiana (explaining why those states are less Democratic than the other Great Lakes states), just so in California, and also in states like Missouri, the Dakotas, Nebraska, etc. Rutherford would very narrowly carry whites in Kentucky and West Virginia, with the latter approximating his winning percentage there, and would narrowly lose them (by 2-4 pts. or so) in North Carolina, despite breaking 60% there. He wins whites in Florida and Virginia, with Trump getting around 40-46% of their vote. In New England, Trump falls into the twenties and in one state (Vermont), into the teens among whites. He's in the thirties in states like New Jersey, Connecticut, New York, New Hampshire, Delaware, Maryland, etc. Overall, whites nationally, as I stated before, would be 55-43% Democratic.

Just some interesting things that I wanted to share.
 
I always though that the Comey letter and the Acuess Hollywood more or less canceled each other out in our own time line, you have just one and it's far worse for Clinton if there's no " grab up " video she probably would have gone on to barely win by less then Al Gore by maybe as little as less the. 1/2 a point getting into near 1960 territory and she lose NV, NH, and MN, so she'd be down to 212 and to make matters worse she'd only get 207 after the EC actually Votes. In a world without the Comey letter and just the Hollywood tape coming out at the same time as it did in our time line you'd see Clinton wins by our same 3 points prehapse as high as 4 points keep MI,PA, as a healthy median with would give Clinton 268 ECVs and trump 270 although when the EC actually voted you'd have a constitutional crisis on hand when 5 Clinton votes defect and 2 trump voters defect so your down to 263 and 268 with 7 other votes, if they were less moronic then in our time line and the faithless electors all coordinated their voters for the same candidate say Kasich. I could then rallying enough in the house to give Kasich a chance but in this senerio we'd probably have descended into near civil war by December tbh. My favorite scenario is where the Hollywood tape comes out 20 days or so before the election but then Comey releases info that trump and his campaign is under investigation for colliding with the Russians... up to and including the trump Jr meeting as well as the Russian bots on social media. Clinton wins by 6 points and win MI, PA, WI, FL, NC, AZ, NE CD 2, ME CD 2 Georgia is so close that the results are disputed till the week of Thanksgiving but ultimately going for trump by less then 10,765 votes Ohio is with in 3 points and Iowa is won by trump by only 5 points McMullian wins Utah as the Clinton camp all but cuts it lose in return for a cabinet position in her administration( secretly of course) Utah is 33 McMullan 32 Trump 20 Clinton 9 Johnson 6 other
 
Serb constituencies.png

1990 Election amongst Bosnian Serbs:
  1. Serbian Democratic Party 109
  2. Alliance of Reformist Forces 15
  3. League of Communists 14
  4. Liberal Democratic Party 5
  5. Serbian Renewal Movement 4
  6. Citizens Democratic Party3
 
  1. Serb constituencies.png
    Serbian Democratic Party 70
  2. Alliance of independent Social Democrats 41
  3. Socialist Party 34
  4. Democratic National Union 7
  5. Serbian Radical Party 2
  6. Serbian Renewal Movement 1
Serbian Democratic Party forms a coalition with the DNS and Serbian Radical Party, while two social democratic parties compete on the left spectrum.
 
S u n b e l t
T r e n d

We've had a single election where the Sun Belt trended D and the Rust Belt trended R... I think it's rather absurd to assume that the trends of one election, especially an extraordinary one that featured two historically unpopular candidates, are going to go on into infinity.
 
We've had a single election where the Sun Belt trended D and the Rust Belt trended R... I think it's rather absurd to assume that the trends of one election, especially an extraordinary one that featured two historically unpopular candidates, are going to go on into infinity.
My prediction is based more off of the trend of wealthier/more minority-filled states tend to trend democratic

As coastal states get richer and more diverse, and more populous; and the internal states become whiter and poorer; they will trend Democratic and Republican respectively (assuming the parties maintain their current bloc-composition)

What does your map look like?
 
We've had a single election where the Sun Belt trended D and the Rust Belt trended R... I think it's rather absurd to assume that the trends of one election, especially an extraordinary one that featured two historically unpopular candidates, are going to go on into infinity.
I mean, if we were going by 2008, it would have said "Democratic Plains!!!"
 
When I put the post up, I was having difficulty with uploading the images. But let me see if I can now:

The revised congressional districts map:

800

And the revised county percentages map:

800


Assistance with my questions about the congressional districts in Tennessee (and elsewhere), would be much appreciated.​
Bringing this forward to generate more attention for the question asked.
 
Besides a few quirks, 2000 trends make for a pretty coherent result:
genusmap.php


(287 D - 251 R)


I don't mean to re-hash the whole "Charlie Baker vs Joe Manchin" thing, but I could see this being the result of a race between a centrist Alabama Democrat with a running mate from Kansas, and a moderate New England Republican with a running mate from Minnesota.
 
Status
Not open for further replies.
Top