President Elect 1988 - Megathread

No Southern Strategy: President-Elect ll
(Obviosuly I can't account for the effects of Reagan picking an African-American for VP in the South)
genusmap.php

Vice President Hubert Humphrey (D-MN)/Governor John Connally (D-TX): 267 EVs, 48%
Governor Ronald Reagan (R-CA)/Senator Edward Brooke (R-MA): 261 EVs, 46%
Former Governor George Wallace (S-AL)/Congressman Albert Watson (S-SC): 10 EVs, 5%
 
Last edited:
Rolling the RNG
(Each candidate that ran for the nomination gets an equal chance.)
genusmap.php

Senate Majority Leader Lyndon B. Johnson (D-TX)/Senator Eugene McCarthy (D-MN): 450 EVs, 51%
Governor Nelson Rockefeller (R-NY)/Treasuary Secretary Robert B. Anderson (R-TX): 87 EVs, 43%
Unpledged Electors: 0 EVs, 6%

genusmap.php

President Lyndon B. Johnson (D-TX)/Vice President Eugene McCarthy (D-MN): 526 EVs, 57%
Governor William Scranton (R-PA)/Congressman William E. Miller (R-NY): 17 EVs, 42%
Governor George Wallace (S-AL)/Former Governor Ross Barnett (S-MS): 0 EVs, 1%

genusmap.php

Senator George McGovern (D-SD)/Governor John Connally (D-TX): 319 EVs, 40%
Governor Nelson Rockefeller (R-NY)/Senator Edward Brooke (R-MA): 174 EVs, 39%
Former Governor George Wallace (A-AL)/Former Agriculture Secretary Ezra Taft Benson (A-UT): 45 EVs, 21%

genusmap.php

President George McGovern (D-SD)/Vice President (D-TX): 452 EVs, 55%
Former Vice President Richard Nixon (R-CA)/Former Governor Jim Rhodes (R-OH): 86 EVs, 45%
genusmap.php

House Minority Leader Gerald Ford (R-MI)/Economist George P. Shultz (R-NY): 432 EVs, 54%
Governor George Wallace (D-AL)/Senator Walter Mondale (D-MN): 106 EVs, 46%
genusmap.php

Senator John F. Kennedy (D-MA)/Senator Edmund Muskie (D-ME): 361 EVs, 57%
President Gerald Ford (R-MI)/Vice President George P. Shultz (R-NY): 177 EVs, 39%
Senator James Buckley (C-NY)/Congressman Phil Crane (C-IL): 0 EVs, 2%

genusmap.php

President John F. Kennedy (D-MA)/Vice President Edmund Muskie (D-ME): 58%
Former Secretary of the Treasury Ronald Reagan (R-CA)/Former Secretary of State George H.W. Bush (R-TX): 42%
genusmap.php

Senator Al Gore Jr. (D-TN)/Senator John Glenn (D-OH): 529 EVs, 59%
General Al Haig (R-PA)/Governor Alan K. Simpson (R-WY): 9 EVs, 40%

 
RNG Elections II

1960

Screen Shot 2016-12-27 at 8.28.02 AM.png

Vice President Richard Nixon (R-CA)/Senator Thruston Morton (R-KY): 405 EVs, 53%

Senator Hubert Humphrey (D-MN)/Governor Herschel Loveless (D-IA): 132 EVs, 47%

1964
(The RNG rolled 2.1% on inflation, 5.4% on unemployment, 6 for GNP growth, the nation being at peace, and a 5/9 on morale.
upload_2016-12-31_21-51-14.png

President Richard Nixon (R-CA)/Vice President Thruston Morton (R-KY): 513 EVs, 58%
Senator Robert Byrd (D-WV)/Senator Robert Kennedy (D-MA*): 25 EVs, 42%

1968

(The RNG rolled 1.1% on inflation, 9.7% unemployment, 7 for GNP growth, the nation at peace, and 4/9 on morale
upload_2016-12-31_21-51-32.png

Senator John Glenn (D-OH)/Senator Fred Harris (D-OK): 385 EVs, 43%
Senator Paul Laxalt (R-NV)/Govenor Robert Finch (R-CA): 108 EVs, 37%
Former Governor George Wallace (A-AL)/Former Secretary Ezra Taft Benson (A-UT): 45 EVs, 19%

1972

(The RNG rolled 3.7% inflation, 9% unemployment, -9 GNP growth, the nation at war (2/9 popularity)
upload_2016-12-31_21-51-47.png

President John Glenn (D-OH)/Vice President Fred Harris (D-OK): 360 EVs, 42%
Senator Howard Baker (R-TN)/Senator George H.W. Bush (R-TX): 159 EVs, 36%
Congressman John Schmitz (A-CA)/Author Thomas Anderson (A-TN): 19 EVs, 22%

1976

(The RNG rolled 1.6% on inflation, 5.1% on unemployment, 4 on GNP growth, a nation at peace, and a 4/9 on morale.)
upload_2016-12-31_21-51-59.png

Senator Dale Bumpers (D-AR)/Congressman Peter Rodino (D-NJ): 518 EVs, 53%
Minority Leader Gerald Ford (R-MI)/Businessman Bill Simon (R-NJ): 20 EVs, 43%


1980 (22nd Amendment repealed prior to election)
(The RNG rolled 8% on inflation, 8.4% on unemployment, -3 on GNP growth, a nation at peace, and a 5/9 on morale.)
upload_2016-12-31_21-52-19.png

President Dale Bumpers (D-AR)/Vice President Peter Rodino (D-NJ): 512 EVs, 49%
Former President Richard Nixon (R-CA)/Businessman Bill Simon (R-NJ): 26 EVs, 40%
Congressman John B. Anderson (N-IL)/Former Senator Ed Brooke (N-MA): 0 EVs, 10%

1984

(The RNG rolled 3.1% on inflation, 5.1% on unemployment, 5 on GNP growth, and a nation at war (7/9 popularity).)
upload_2016-12-31_21-52-33.png

Secretary Ed Muskie (D-ME)/Senator Bill Bradley (D-NJ): 502 EVs, 49%
Senator Paul Laxalt (R-NV)/Congresswoman Lynn Morley Martin (R-IL): 36 EVs, 35%
Former Congressman John B. Anderson (N-IL)/Former Governor Hugh Carey (N-NY): 0 EVs, 15%

1988

(The RNG rolled 1.7% on inflation, 9.6% unemployment, -5 on GNP growth, a nation at peace, and 2/9 on morale.)
upload_2016-12-31_21-52-44.png

Former President Richard Nixon (R-CA)/Former Senator Paul Laxalt (R-NV): 464 EVs, 53%
President Ed Muskie (D-ME)/Vice President Bill Bradley (D-NJ): 74 EVs, 46%

what even is this
 
A TIME FOR CHOOSING: ELECTION OF 1960
What if both JFK and Nixon died in late 1959?

genusmap.php


Senator Barry Goldwater / Treasury Secretary Robert B. Anderson (Republican) ~ 290 EVs ~ 20,768,492 (39.05%)
Senator Henry M. "Scoop" Jackson / Senator George Smathers (Democratic) ~ 247 EVs ~ 21,082,576 (39.64%)

Businessman R. K. Mellon / Lieutenant General Ira C. Eaker (Independent) ~ 0 EVs ~ 11,328,925 (21.30%)

1960 STATS
INFLATION: 1.9%
UNEMPLOYMENT: 6.2%
GNP GROWTH: 2.0%
PEACE
PEACE/WAR LEVEL:
4
 
Screen Shot 2017-02-07 at 8.52.22 AM.png

Lt. Col. Oliver North (R-VA)/Gov. James Thompson (R-IL): 535 EVs, 58%
Rep. Pat Schroder (D-CO)/Sen. Sam Nunn (D-GA): 3 EVs, 41%
Sen. Lowell Weicker (I-CT)/I forgot: 0 EVs, 0%
 
Replacing the candidates with those who were the leading the main British parties of the time.

1960:

Gaitskell (Democratic) - 28,629,320 (46%) and 341 electoral votes
Macmillan (Republican) - 28,004,464 (45%) and 196 electoral votes
Grimond (Independent) - 4,807,499 (8%) and 0 electoral votes

Gaitskell ran strong in on the West Coast, took NY and PA and swept most of the South.

1964:

Wilson (Democratic) - 30,055,492 (50%) and 440 electoral votes
Douglas-Home (Republican) - 22,408,352 (37%) and 98 electoral votes
Grimond (Independent) - 7,558,386 (12%) and 0 electoral votes

As long as circumstances weren't too unfavourable for his party, Wilson would have no doubt hammered Douglas-Home in a presidential contest. Wilson was built for the TV age, Douglas-Home was not.

1968:

Heath (Republican) - 30,168,084 (46%) and 365 electoral votes
Wilson (Democratic) - 27,473,040 (42%) and 173 electoral votes
Thorpe (Independent) - 7,850,308 (12%) and 0 electoral votes

^ So not far off from the actual 1970 UK general election, at least in popular vote percentages.

More to come later.

 
1972:

Wilson (Democratic) - 37,860,956 (49%) and 365 electoral votes
Heath (Republican) - 36,192,668 (47%) and 173 electoral votes
Thorpe (Independent) - 3,346,825 (4%) and 0 electoral votes

Heath wasn't the political maestro that Nixon was so this may well have happened.

1976:

Thatcher (Republican) - 43,106,896 (49%) and 434 electoral votes
Callaghan (Democratic) - 38,893,424 (44%) and 104 electoral votes
Steel (Independent) - 6,472,662 (7%) and 0 electoral votes

As in the 1979 UK GE, the left raw vote rose compared to the previous election but still lost handily.
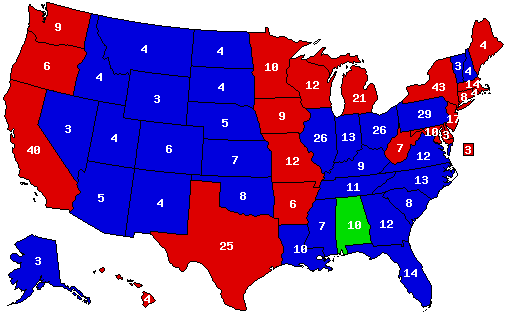
1980:

Callaghan (Democratic) - 45,544,072 (50%) and 366 electoral votes
Thatcher (Republican) - 42,668,332 (47%) and 172 electoral votes
Steel (Independent) - 2,454,462 (3%) and 0 electoral votes

Callaghan swept the North and came roaring back in the South, pushing her to within 2-3% in most and winning Alabama and Arkansas. Presumably Thatcherite economics didn't go down well.

1984:

Thatcher (Republican) - 51,239,652 (55%) and 511 electoral votes
Kinnock (Democratic) - 41,855,668 (45%) and 27 electoral votes
Owen (Independent) - 500,810 (0%) and 0 electoral votes

Thatcher back with a bang; Kinnock doesn't have Callaghan's wider appeal. And LOL at Owen.

1988:

Thatcher (Republican) - 63,574,864 (63%) and 535 electoral votes
Kinnock (Democratic) - 36,572,736 (36%) and 3 electoral votes
Ashdown (Independent) - 173,540 (0%) and 0 electoral votes

The good economy shifts the "Ohio man" even more sharply to Thatcher and the Republicans get an avalanche.

1992:

Major (Republican) - 49,267,696 (49%) and 373 electoral votes
Smith (Democratic) - 46,042,584 (46%) and 165 electoral votes
Ashdown (Independent) - 5,242,007 (5%) and 0 electoral votes

Smith made impressive inroads, particularly in the Northeast. Narrow victories in OH, MI, IL, CA and NJ gave the Republicans another term. The bad economic conditions meant that the third-party vote was the highest in sixteen years.

1996:

Blair (Democratic) - 55,410,960 (53%) and 460 electoral votes
Major (Republican) - 48,255,776 (46%) and 78 electoral votes
Ashdown (Independent) - 1,522,862 (1%) and 0 electoral votes

The Democrats win their first election since 1980 on a 'Time for Change' factor, with Blair sweeping pretty much everything but the rural West.

More later.

 
2000:

Blair (Democratic) - 58,024,316 (57%) and 513 electoral votes
Hague (Republican) - 42,875,936 (42%) and 25 electoral votes
Kennedy (Independent) - 159,232 (0%) and 0 electoral votes

Blair is re-elected and wins every Southern state, with Hague only holding onto a few traditionally Republican states in the West. Kennedy makes no impact.

2004:

Blair (Democratic) - 49,668,136 (50%) and 503 electoral votes
Howard (Republican) - 35,571,968 (35%) and 35 electoral votes
Kennedy (Independent) - 14,698,704 (15%) and 0 electoral votes

The unpopularity of the Iraq War leads to the most impressive third-party showing in decades. Calls for a review of the electoral system become louder in the aftermath of the election.

2008:

Cameron (Republican) - 57,082,352 (58%) and 535 electoral votes
Brown (Democratic) - 31,055,672 (32%) and 3 electoral votes
Clegg (Independent) - 9,661,002 (10%) and 0 electoral votes

The Democrats' reign comes to an end. What did for Brown (Blair's Treasury Secretary) was the fact that the financial crisis struck in the middle of the fall campaign. Combining that with Cameron's social liberalism meant that the Republicans swept the country.

2012:

Miliband (Democratic) - 43,640,668 (45%) and 340 electoral votes
Cameron (Republican) - 41,798,232 (43%) and 198 electoral votes
Clegg (Independent) - 10,594,939 (11%) and 0 electoral votes

Cameron's austerity measures mean that the Midwest turns sharply against him, with Ohio voting for Miliband by a margin of 48-38. (Btw, the map looks surprisingly reasonable at this point - IN, KY, WV and MO voted Dem while NH voted Rep, but given that the candidates from both parties have tended to be a bit ideologically different to what Americans have become used to, that's understandable.)

2016:

Corbyn (Democratic) - 52,105,872 (54%) and 503 electoral votes
May (Republican) - 38,348,416 (40%) and 35 electoral votes
Farron (Independent) - 5,980,905 (6%) and 0 electoral votes

In what may (ha ha) be forever known (at least by right-wing pundits) as Red November, Corbyn wins a landslide victory after having defeated President Miliband in a populist upsurge during the Democratic primaries. Most expected him to lose handily at the time of the party conventions, and the polls reflected this. However, a solid campaign by him and gaffes and u-turns by May led him to perhaps the biggest upset victory ever.
 
Top